
CFP Special Issue On: SURGE, Physics Games, and the Role of Design
Submission Due Date
5/15/2017
Guest Editors
Douglas Clark, Vanderbilt University, Nashville, TN, USA
Introduction
The purpose of this special issue is to investigate the role of design in the efficacy of physics games in terms of what is learned, by whom, and how. Importantly, studies should move beyond basic media comparisons (e.g., game versus non-game) to instead focus on the role of design and specifics about players’ learning processes. Thus, invoking the terminology proposed by Richard Mayer (2011), the focus should be on value-added and cognitive consequences approaches rather than media comparison approaches. Note that a broad range of research methodologies including a full gamut of qualitative, ethnographic, and microgenetic methodologies are encouraged as well as quantitative and data-mining perspectives. Furthermore, the focal outcomes and design qualities analyzed can span the range of functional, emotional, transformational, and social value elements outlined by Almquist, Senior, and Bloch (2016).
Recommended Topics
Authors are invited to submit manuscripts that
- Focus on the role of design beyond simple medium (i.e., move beyond simple of tests of whether physics games can support learning to instead focus on how the design of the game, learning environment, and social setting influence what is learned, by whom, and how).
- Explore learning in games from the SURGE constellation of physics games and other physics games using qualitative, mixed, design-based research, quantitative, data-mining, or other methodologies.
- Focus on formal, recreational, and/or informal learning settings.
- Focus on any combination of player, student, teacher, designer, and/or any of other participants.
- Answer specific questions such as:
- How do specific approaches to integrating learning constructs from educational psychology (e.g., work examples, signaling, self-explanation) impact the efficacy of these approaches within digital physics games for learning?
- How do elements of design impact the value experienced by players in terms of the elements of functional, emotional, transformational, and social value outlined by Almquist, Senior, and Bloch (2016)?
- What is the role of the teacher in interaction with students and the design of a game in terms of learning outcomes?
- How does game design interact with gender in terms of what is learned, by whom, and how?
- How can designers balance learning goals and game-play goals to best support a diverse range of players and learners?
- How do specific sets of design features interact with players’ learning processes and game-play goals?
Submission Procedure
Potential authors are encouraged to contact Douglas Clark (clark@vanderbilt.edu) to ask about the appropriateness of their topic.
Authors should submit their manuscripts to the submission system using the link at the bottom of the call (Please note authors will need to create a member profile in order to upload a manuscript.).
Manuscripts should be submitted in APA format.
They will typically be 5000-12000 words in length.
Full submission guidelines can be found at: http://www.igi-global.com/publish/contributor-resources/before-you-write/

All submissions and inquiries should be directed to the attention of:
Douglas Clark
Guest Editor
International Journal of Gaming and Computer-Mediated Simulations (IJGCMS)
Email: clark@vanderbilt.edu

Can UX research take a game that is not fun, and make it more fun?
CFP: UX — What is User Experience in Video Games?
The purpose of this special issue is to investigate the nature of video game UX.
ISO 9241-210[1] defines user experience as “a person’s perceptions and responses that result from the use or anticipated use of a product, system or service”. According to the ISO definition, user experience includes all the users’ emotions, beliefs, preferences, perceptions, physical and psychological responses, behaviors and accomplishments that occur before, during and after use. The ISO also list three factors that influence user experience: system, user and the context of use.
In this issue we hope to present practitioners and academic perspectives through presenting a broad range of user experience evaluation methods and concepts; application of various user experience evaluation methods; how UX fits into video game development cycle; methods of evaluating user experience during game play and after; and social play.
Authors are invited to submit manuscripts that
- Present empirical findings on UX in game development
- Push the theoretical knowledge of UX
- Conduct meta-analyses of existing research on UX
- Answer specific questions such as:
- Case studies, worked examples, empirical and phenomenological, application of psychological and humanist approaches?
- Field research
- Universal Access
- Face to face interviewing
- Creation of user tests
- Gathering and organizing statistics
- Define Audience
- User scenarios
- Creating Personas
- Product design
- Feature writing
- Requirement writing
- Content surveys
- Graphic Arts
- Interaction design
- Information architecture
- Process flows
- Usability
- Prototype development
- Interface layout and design
- Wire frames
- Visual design
- Taxonomy and terminology creation
- Copywriting
- Working with programmers and SMEs
- Brainstorm and managing scope (requirement) creep
- Design and UX culture
- What is the difference between user experience and usability?
- How does UX research extend beyond examination of the UI? Should we differentiate pragmatic and hedonic aspects of the game?
- Who is a User Experience researcher, what do they do, and how does one become one?
- What are the methodologies?
Potential authors are encouraged to contact Brock Dubbels (Dubbels@mcmaster.ca) to ask about the appropriateness of their topic.
Deadline for Submission January 2014.
Authors should submit their manuscripts to the submission system using the following link:
http://www.igi-global.com/authorseditors/titlesubmission/newproject.aspx
(Please note authors will need to create a member profile in order to upload a manuscript.)
Manuscripts should be submitted in APA format.
They will typically be 5000-8000 words in length.
Full submission guidelines can be found at: http://www.igi-global.com/journals/guidelines-for-submission.aspx
Mission – IJGCMS is a peer-reviewed, international journal devoted to the theoretical and empirical understanding of electronic games and computer-mediated simulations. IJGCMS publishes research articles, theoretical critiques, and book reviews related to the development and evaluation of games and computer-mediated simulations. One main goal of this peer-reviewed, international journal is to promote a deep conceptual and empirical understanding of the roles of electronic games and computer-mediated simulations across multiple disciplines. A second goal is to help build a significant bridge between research and practice on electronic gaming and simulations, supporting the work of researchers, practitioners, and policymakers.
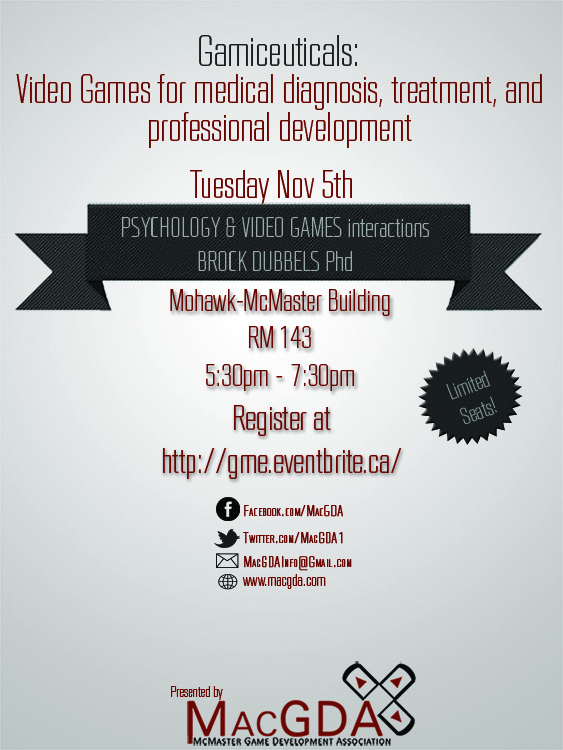
Gamiceuticals: Video Games for medical diagnosis, treatment,
and professional development
Should games and play be used to diagnose or treat a medical condition? Can video games provide professional development for health professionals? To gather medical data? To provide adherence and behavioral change? Or even become a part of our productivity at work? In this presentation psychological research will be presented to make a case for how games are currently, and potentially, can be used in the eHealth and medical sector.
Join MacGDA for a talk with Brock Dubbels on issues related to games, health, and psychology.
 Sign up at http://gme.eventbrite.ca/
Brock Dubbels is an experimental psychologist at the G-Scale Game development and testing laboratory at McMaster University in Hamilton, Ontario. His appointment includes work in the Dept. of Computing and Software (G-Scale) and the McMaster Research Libraries. Brock specializes in games and software for knowledge and skill acquisition, eHealth, and clinical interventions.
Brock Dubbels has worked since 1999 as a professional in education and instructional design. His specialties include comprehension, problem solving, and game design. From these perspectives he designs face-to-face, virtual, and hybrid learning environments, exploring new technologies for assessment, delivering content, creating engagement with learners, and investigating ways people approach learning. He has worked as a Fulbright Scholar at the Norwegian Institute of Science and Technology; at Xerox PARC and Oracle, and as a research associate at the Center for Cognitive Science at the University of Minnesota. He teaches course work on games and cognition, and how learning research can improve game design for return on investment (ROI). He is also the founder and principal learning architect at www.vgalt.com for design, production, usability assessment and evaluation of learning systems and games.
Join the MacMaster Game Development Association: http://macgda.com/


What we cannot know or do individually, we may be capable of collectively.
My research examines the transformation of perceptual knowledge into conceptual knowledge. Conceptual knowledge can be viewed as crystallized, which means that it has become abstracted and is often symbolized in ways that do not make the associated meaning obvious. Crystallized knowledge is the outcome of fluid intelligence, or the ability to think logically and solve problems in novel situations, independent of acquired knowledge. I investigate how groups and objects may assist in crystallization of knowledge, or the construction of conceptual understanding.
I am currently approaching this problem from the perspective that cognition is externalized and extended through objects and relationships. Â This view posits that skill, competence, knowledge are learned through interaction aided with objects imbued with collective knowledge.
Groups make specialized information available through objects and relationships so that individual members can coordinate their actions and do things that would be hard or impossible for them to enact individually. To examine this, I use a socio-cognitive approach, which views cognition as distributed, where information processing is imbued in objects and communities and aids learners in problem solving.
This socio-cognitive approach is commonly associated with cognitive ethnography and the study of social networks. In particular, I have special interest in how play, games, modeling, and simulations can be used to enhance comprehension and problem solving through providing interactive learning. In my initial observational studies, I have found that games are structured forms of play, which work on a continuum of complexity:
- Pretense, imagery and visualization of micro worlds
- Tools, rules, and roles
- Branching / probability
Games hold communal knowledge, which can be learned through game play. An example of this comes from the board game Ticket to Ride. In this strategy game players take on the role of a railroad tycoon in the early 1900′s. The goal is to build an empire that spans the United States while making shrewd moves that block your opponents from being able to complete their freight and passenger runs to various cities. Game play scaffolds the learner in the history and implications of early transportation through taking on the role of an entrepreneur and learning the context and process of building up a railroad empire. In the course of the game, concept are introduced, with language, and value systems based upon the problem space created by the game mechanics (artifacts, scoring, rules, and language). The game can be analyzed as a cultural artifact containing historical information; a vehicle for content delivery as a curriculum tool; as well as an intervention for studying player knowledge and decision-making.
I have observed that learners interact with games with growing complexity of the game as a system. As the player gains top sight, a view of the whole system, they play with greater awareness of the economy of resources, and in some cases an aesthetic of play. For beginning players, I have observed the following progression:
- Trial and error – forming a mental representation, or situation model of how the roles, rules, tools, and contexts work for problem solving.
- Tactical trials – a successful tactic is generated to solve problems using the tools, rules, roles, and contexts. This tactic may be modified for use in a variety of ways as goals and context change in the game play.
- Strategies—the range of tactics of resulted in strategies that come from a theory of how the game works. This approach to problem solving indicates a growing awareness of systems knowledge, the purpose or criteria for winning, and is a step towards top sight. They understand that there are decision branches, and each decision branch comes with risk reward they can evaluate in the context of economizing resources.
- Layered strategies—the player is now making choices based upon managing resources because they are now economizing resources and playing for optimal success with a well-developed mental representation of the games criteria for winning, and how to have a high score rather than just finish.
- Aesthetic of play—the player understands the system and has learned to use and exploit ambiguities in the rules and environment to play with an aesthetic that sets the player apart from others. The game play is characterized with surprising solutions to the problem space.
For me, games are a structured form of play. As an example, a game may playfully represent an action with associated knowledge, such as becoming a railroad tycoon, driving a high performance racecar, or even raising a family. Games always involve contingent decision-making, forcing the players to learn and interact with cultural knowledge simulated in the game.
Games currently take a significant investment of time and effort to collectively construct. These objects follow in a history of collective construction by groups and communities. Consider the cartography and the creation of a map as an example of collective distributed knowledge imbued in an object. Â According to Hutchins (1996),
“A navigation chart represents the accumulation of more observations than any one person could make in a lifetime. It is an artifact that embodies generations of experience and measurement. No navigator has ever had,nor will one ever have, all the knowledge that is in the chart.â€
A single individual can use a map to navigate an area with competence, if not expertise. Observing an individual learning to use a map, or even construct one is instructive for learning about comprehension and decision-making. Interestingly, games provide structure to play, just as maps and media appliances provide structure to data to create information. Objects such as maps and games are examples of collective knowledge, and are what Vygotsky termed a pivot.
The term pivot was initially conceptualized in describing children’s play, particularly as a toy. A toy is a representation used in aiding knowledge construction in early childhood development. This is the transition where children may move from recognitive play to symbolic and imaginative play, i.e. the child may play with a phone the way it is supposed to be used to show they can use it (recognitive), and in symbolic or imaginative play, they may pretend a banana is the phone.
This is an important step since representation and abstraction are essential in learning language, especially print and alphabetical systems for reading and other discourse. In this sense, play provides a transitional stage in this direction whenever an object (for example a stick) becomes a pivot for severing meaning of horse from a real horse. The child cannot yet detach thought from object. (Vygotsky, 1976, p 97). For Vygotsky, play represented a transition in comprehension and problem solving –where the child moved from external processing — imagination in action —to internal processing — imagination as play without action.
In my own work, I have studied the play of school children and adults as learning activities. This research has informed my work in classroom instruction and game design. Learning activities can be structured as a game, extending the opportunity to learn content, and extend the context of the game into other aspects of the learner’s life, providing performance data and allowing for self-improvement with feedback, and data collection that is assessed, measured and evaluated for policy.
My research and publications have been informed by my work as a tenured teacher and software developer. A key feature of my work is the importance of designing for learning transfer and construct validity. When I design a learning environment, I do so with research in mind. Action research allows for reflection and analysis of what I created, what the learners experienced, and an opportunity to build theory. What is unique about what I do is the systems approach and the way I reverse engineer play as a deep and effective learning tool into transformative learning, where pleasurable activities can be counted as learning.
Although I have published using a wide variety of methodologies, cognitive ethnography is a methodology typically associated with distributed cognition, and examines how communities contain varying levels of competence and expertise, and how they may imbue that knowledge in objects. I have used it specifically on game and play analysis (Dubbels 2008, 2011). This involves observation and analysis of Space or Context—specifically conceptual space, physical space, and social space. The cognitive ethnographer transforms observational data and interpretation of space into meaningful representations so that cognitive properties of the system become visible (Hutchins, 2010; 1995). Cognitive ethnography seeks to understand cognitive process and context—examining them together, thus, eliminating the false dichotomy between psychology and anthropology. This can be very effective for building theories of learning while being accessible to educators.
My current interest is in the use of cognitive ethnographic methodology with traditional form serves as an opportunity to move between inductive and deductive inquiry and observation to build a Nomological network (Cronbach & Meehl, 1955) using measures and quantified observations with the Multiple Trait and Multiple Method Matrix Analysis (Campbell & Fiske, 1959) for construct validity (Cook & Campbell, 1979; Campbell & Stanley, 1966) especially in relation to comprehension and problem solving based upon the Event Indexing Model (Zwaan & Radvansky, 1998).
We distribute knowledge because it is impossible for a single human being, or even a group to have mastery of all knowledge and all skills (Levy, 1997). For this reason I study access and quality of collective group relations and objects and the resulting comprehension and problem solving. The use of these objects and relations can scaffold learners and inform our understanding of how perceptual knowledge is internalized and transformed into conceptual knowledge through learning and experience.
Specialties
Educational research in cognitive psychology, social learning. identity, curriculum and instruction, game design, theories of play and learning, assessment, instructional design, and technology innovation.
Additionally:
The convergence of media technologies now allow for collection, display, creation, and broadcast of information as narrative, image, and data. This convergence of function makes two ideas important in the study of learning:
- The ability to create of media communication through narrative, image, and data analysis and information graphics is becoming more accessible to non-experts through media appliances such as phones, tablets, game consoles and personal computers.
- These media appliances have taken very complex behaviors such as film production, which in the past required teams of people with special skill and knowledge, and have imbued these skills and knowledge in hand-held devices that are easy to use, and are available to the general population.
- This accessibility allows novices to learn complex media production, analysis, and broadcast, and allows for the study of these devices as object that has been imbued with the knowledge and skill, as externalized cognitionThrough the use of these devices, the general population may learn complex skills and knowledge that may have required years of specialized training in the past. Study of the interaction between of individuals learning to use these appliances and devices can be studied as a progression of internalizing knowledge and skill imbued in objects.
- The convergence of media technologies into small, single–even handheld—devices emphasizes that technology for producing media may change, but the narrative has remained relatively consistent.
- This consistency of media as narrative, imagery, and data analysis emphasizes the importance of the continued study of narrative comprehension and problem solving through the use of these media appliances.
 Gamefuscation?
I am concerned that Gamefication obfuscates the real issue in learning:
Transfer.
Is there evidence that game-based learning leads to far transfer?
Without learning transfer, it doesn’t matter how a person learned–whether from a piece of software, watching an expert, rote memorization, or the back of cereal box. What is important is that learning occurred, and how we know that learning occurred.
This leads to issues of assessment and evaluation.
Transfer and Games:Â How do we assess this?
The typical response from gameficators is that assessment does not measure the complex learning from games. I have been there and said that. Â But I have learned that is overly dismissive of assessment and utterly simplistic. As I investigated assessment and psychometrics, I have learned how simplistic were my statements. Games themselves are assessment tools, and I learned that by learning about assessment.
This Gameficator–(yes I am now going to 3rd person)–had to seek knowledge beyond his ludic and narratological powers. He had to learn the mysteries and great lore of psychometrics, instructional design, and educational psychology. It was through this journey into the dark arts, that he has been able to overcome some of the traps of Captain Obvious, and his insidious powers to sidetrack and obfuscate through jargonification,and worse–like taking credit for previously documented phenomena by imposing a new name. . . kind of like my renaming Canada to the now improved, muchmorebetter name: Candyland.
In reality, I had to learn the language and content domain of learning to be an effective instructional designer, just as children learn the language and content domains of science, literature, math, and civics.
What I have learned through my journey, is that if a learner cannot explain a concept, that this inability to explain and demonstrate may be an indicator that the learning from the game experience is not crystallized–that the learner does not have a conceptual understanding that can be explained or expressed by that learner.
Do games deliver this?
Does gamefied learning deliver this?
Gameficators need to address this if this is to be more than a captivating trend.
I am fearful that the good that comes from this trend will not matter if we are only creating  jargonification (even if it is more accessible). It is not enough to redescribe an established instructional design technique if we cannot demonstrate its effectiveness.  We should be asking how learning in game-like contexts enhances learning and how to measure that.
 Measurement and testing are important because well-designed tests and measures can deliver an assessment of crystallized knowledge–does the learner have a chunked conceptual understanding of a concept, such as “resistance”, “average”, “setting”?
Sure, students may have a gist understanding of a concept. The teacher may even see this qualitatively, but the student cannot express it in a test. So is that comprehension? I think not. The point of the test is an un-scaffolded demonstration of comprehension.
Maybe the game player has demonstrated the concept of “resistance” in a game by choosing a boat with less resistance to go faster in the game space– but this is not evidence that they understand the term conceptually. This example from a game may be an important aspect of perceptual learning, that may lead to the eventual ability to explain (conceptual learning); but it is not evidence of comprehension of “resistance” as a concept.
So when we look at game based learning, we should be asking what it does best, not whether it is better. Games can become a type of assessment where contextual knowledge is demonstrated. But we need to go beyond perceptual knowledge–reacting correctly in context and across contexts–to conceptual knowledge: the ability to explain and demonstrate a concept.
My feeling is that one should be skeptical of Gameficators that pontificate without pointing to the traditions in educational research. If Gamefication advocates want to influence education and assessment, they should attempt to learn the history, and provide evidential differences from the established terms they seek  to replace.
A darker shadow is cast
Another concern I have is that  perhaps not all gameficators are created equal. Maybe some gameficators are not really advocatingfor the game elements that are really fundamental aspects of games? Maybe there are people with no ludic-narratological powers donning the cape of gamefication! I must ask, is this leaderboard what makes for “gameness”? Or does a completion task-bar make for gamey experience?
Does this leaderboard for shoe preference tell us anything but shoe preference? Where is the game?
Are there some hidden game mechanics that I am failing to apprehend?
Is this just villainy?
Here are a couple of ideas that echo my own concerns:
It seems to me, that:
- some of the elements of gamefication rely heavily on aspects of games that are not new, just rebranded.
- some of the elements of gamefication aren’t really “gamey”.
What I like about games is that games can provide multimodal experiences, and provide context and prior knowledge without the interference of years of practice-this is new. Games accelerate learning by reducing the some of the gatekeeping issues. Now a person without the strength, dexterity and madness can share in some of the experience of riding skateboard off a ramp.  The benefit of games may be in the increased richness of a virtual interactive experience,  and provide the immediate task competencies without the time required to become competent. Games provide a protocol, expedite, and scalffold players toward a fidelity of conceptual experience.
For example, in RIDE, the player is immediately able to do tricks that require many years of practice because the game exaggerates the fidelity of experience. Â This cuts the time it might take to develop conceptual knowledge but reducing the the necessity of coordination, balance, dexterity and insanity to ride a skateboard up a ramp and do a trick in the air and then land unscathed.
Gameficators might embrace this notion.
Games can enhance learning in a classroom, and enhance what is already called experiential learning.
My point:
words, terms, concepts, and domain praxis matter.
Additionally, we seem to be missing the BIG IDEA:
- that the way we structure problems is likely predictive of a successful solutionHerb Simon expressed the idea in his book The Sciences of the Artificial this way:
“solving a problem simply means representing it so as to make the solution transparent.” (1981: p. 153)
Games can help structure problems.
But do they help learners understand how to structure a problem. Do they deliver conceptualized knowledge? Common vocabulary indicative of a content domain?
The issue is really about What Games are Good at Doing, not whether they are better than some other traditional form of instruction.
Do they help us learn how to learn? Do they lead to crystallized conceptual knowledge that is found in the use of common vocabulary? In physics class, when we mention “resistance”, students should offer more than
“Resistance is futile”
or, a correct but non-applicable answer such as “an unwillingness to comply”.
The key is that the student can express the expected knowledge of the content domain in relation to the word. This is often what we test for. So how do games lead to this outcome?
I am not hear to give gameficators a hard time–I have a gamefication badge (self-created)–but I would like to know that when my learning is gamefied that the gameficator had some knowledge from the last century of instructional design and learning research, just as I want my physics student to know that resistance as an operationalized concept in science, not a popular cultural saying from the BORG.
The concerns expressed here are applicable in most learning contexts. But if we are going to advocate the use games, then perhaps we should look at how good games are effective, as well as how good lessons are structured. Perhaps more importantly,
- we may need to examine our prevalent misunderstandings about learning assessment;
- perhaps explore the big ideas and lessons that come from years educational psychology research, rather than just renaming and creating new platform without realizing or acknowledging, that current ideas in gamefication stand on the established shoulders of giants from a century of educational research.
Jargonification is a big concern. So lets make our words matter and also look back as we look forward. Games are potentially powerful tools for learning, but not all may be effective in every purpose or context. What does the research say?
I am hopeful gamefication delivers a closer look at how game-like instructional design may enhance successful learning.
I don’t think anyone would disagree — fostering creativity should be a goal of classroom learning.

However, the terms creativity and innovation are often misused. When used they typically imply that REAL learning cannot be measured. Fortunately, we know A LOT about learning and how it happens now. It is measurable and we can design learning environments that promote it. It is the same with creativity as with intelligence–we can promote growth in creativity and intelligence through creative approaches to pedagogy and assessment. Because data-driven instruction does not kill creativity, it should promote it.
One of the ways we might look at creativity and innovation is through the much maligned tradition of intelligence testing as described in the Wikipedia:
Fluid intelligence or fluid reasoning is the capacity to think logically and solve problems in novel situations, independent of acquired knowledge. It is the ability to analyze novel problems, identify patterns and relationships that underpin these problems and the extrapolation of these using logic. It is necessary for all logical problem solving, especially scientific, mathematical and technical problem solving. Fluid reasoning includes inductive reasoning and deductive reasoning, and is predictive of creativity and innovation.
Crystallized intelligence is indicated by a person’s depth and breadth of general knowledge, vocabulary, and the ability to reason using words and numbers. It is the product of educational and cultural experience in interaction with fluid intelligence and also predicts creativity and innovation.
The Myth of Opposites
Creativity and intelligence are not opposites. It takes both for innovation.
What we often lack are creative ways of measuring learning growth in assessments. When we choose to measure growth in summative evaluations and worksheets over and over , we nurture boredom and kill creativity.
To foster creativity, we need to adopt and implement pedagogy and curriculum that promotes creative problems solving, and also provides criteria that can measure creative problem solving.
What is needed are ways to help students learn content in creative ways through the use of creative assessments.
We often confuse the idea of  learning creatively with trial and error and play, free of any kind of assessment–that somehow the Mona Lisa was created through just free play and doodling. That somehow assessment kills creativity.  Assessment provide learning goals.
Without learning criteria, students are left to make sense of the problem put before them with questions like “what do I do now?” (ad infinitum).
The role of the educator is to design problems so that the solution becomes transparent. This is done through providing information about process, outcome, and quality criteria . . . assessment, is how it is to be judged. For example, “for your next assignment, I want a boat that is beautiful and  that is really fast. Here are some examples of boats that are really fast.  Look at the hull, the materials they are made with, etc. and design me a boat that goes very fast and tell me why it goes fast. Tell me why it is beautiful.” Now use the terms from the criteria. What is beautiful? Are you going to define it? How about fast? Fast compared to what? These open-ended, interest-driven, free play assignments might be motivating, but they lead to quick frustration and lots of “what do I do now?”
But play and self-interest arte not the problem here. The problem is the way we are approaching assessment.
Although play is described as a range of voluntary, intrinsically motivated activities normally associated with recreational pleasure and enjoyment; Pleasure and enjoyment still come from judgements about one’s work–just like assessment–whether finger painting or creating a differential equation. The key feature here is that play seems to involve self-evaluation and discovery of key concepts and patterns. Assessments can be constructed to scaffold and extend this, and this same process can be structured in classrooms through assessment criteria.
Every kind of creative play activity has evaluation and self-judgement: the individual is making judgements about pleasure, and often why it is pleasurable. This is often because they want to replicate this pleasure in the future, and oddly enough, learning is pleasurable. So when we teach a pleasurable activity, the learning may be pleasurable. This means chunking the learning and concepts into larger meaning units such as complex terms and concepts, which represent ideas, patterns, objects, and qualities. Thus, crystallized intelligence can be constructed through play as long as the play experience is linked and connected to help the learner to define and comprehend the terms (assessment criteria). So when the learner talks about their boat, perhaps they should be asked to sketch it first, and then use specific terms to explain their design:
Bow is the frontmost part of the hull
Stern is the rear-most part of the hull
Port is the left side of the boat when facing the Bow
Starboard is the right side of the boat when facing the Bow
Waterline is an imaginary line circumscribing the hull that matches the surface of the water when the hull is not moving.
Midships is the midpoint of the LWL (see below). It is half-way from the forwardmost point on the waterline to the rear-most point on the waterline.
Baseline an imaginary reference line used to measure vertical distances from. It is usually located at the bottom of the hull
Along with the learning activity and targeted learning criteria and content, the student should be asked a guiding question to help structure their description.
So, how do these parts affect the performance of the whole?
Additionally, the learner should be adopting the language (criteria) from the rubric to build comprehension. Taking perception, experience, similarities and contrasts to understand Bow and Stern, or even Beauty.
Experiential Learning for Fluidity and Crystallization
What the tradition of intelligence offers is an insight as to how an educator might support students. What we know is that intelligence is not innate. It can change through learning opportunities. The goal of the teacher should be to provide experiential learning that extends Fluid Intelligence, through developing problem solving, and link this process to crystallized concepts in vocabulary terms that encapsulate complex process, ideas, and description.
The real technology in a 21st Century Classroom is in the presentation and collection of information. It is the art of designing assessment for data-driven decision making. The role of the teacher should be in grounding crystallized academic concepts in experiential learning with assessments the provide structure for creative problem solving. The teacher creates assessments where the learning is the assessment. The learner is scaffolded through the activity with guidance of assessment criteria.
A rubric, which provides criteria for quality and excellence can scaffold creativity innovation, and content learning simultaneously. A well-conceived assessment guides students to understand descriptions of quality and help students to understand crystallized concepts.
An example of a criteria-driven assessment looks like this:
| Purpose & Plan | Isometric Sketch | Vocabulary | Explanation | |
| Level up | Has identified event and hull design with reasoning for appropriateness. | Has drawn a sketch where length, width, and height are represented by lines 120 degrees apart, with all measurements in the same scale. | Understanding is clear from the use of five key terms from the word wall to describe how and why the boat hull design will be successful for the chosen event. | Clear connection between the hull design, event, sketch, and important terms from word wall and next steps for building a prototype and testing. |
| Approaching | Has chosen a hull that is appropriate for event but cannot connect the two. | Has drawn Has drawn a sketch where length, width, and height are represented. | Uses five key terms but struggles to demonstrate understanding of the terms in usage. | Describes design elements, but cannot make the connection of how they work together. |
| Do it again | Has chosen a hull design but it may not be appropriate for the event. | Has drawn a sketch but it does not have length, width, and height represented. | Does not use five terms from word wall. | Struggles to make a clear connection between design conceptual design stage elements. |
What is important about this rubric is that it guides the learner in understanding quality and assessment. It also familiarizes the learner with key crystallized concepts as part of the assessment descriptions. In order to be successful in this playful, experiential activity (boat building),  the learner must learn to comprehend and demonstrate knowledge of the vocabulary scattered throughout the rubric such as: isometric, reasoning, etc. This connection to complex terminology grounded with experience is what builds knowledge and competence. When an educator can coach a student connecting their experiential learning with the assessment criteria, they construct crystallized intelligence through grounding the concept in experiential learning, and potentially expand fluid intelligence through awareness of new patterns in form and structure.
Play is Learning, Learning is Measurable
Just because someone plays, or explores does not mean this learning is immeasurable. The truth is, research on creative breakthroughs demonstrate that authors of great innovation learned through years of dedicated practice and were often judged, assessed, and evaluated.  This feedback from their teachers led them to new understanding and new heights. Great innovators often developed crystallized concepts that resulted from experience in developing fluid intelligence. This can come from copying the genius of others by replicating their breakthroughs; it comes from repetition and making basic skills automatic, so that they could explore the larger patterns resulting from their actions. It was the result of repetition and exploration, where they could reason, experiment, and experience without thinking about the mechanics of their actions.  This meant learning the content and skills from the knowledge domain and developing some level of automaticity. What sets an innovator apart it seems, is tenacity and being playful in their work, and working hard at their play.
According to Thomas Edison:
During all those years of experimentation and research, I never once made a discovery. All my work was deductive, and the results I achieved were those of invention, pure and simple. I would construct a theory and work on its lines until I found it was untenable. Then it would be discarded at once and another theory evolved. This was the only possible way for me to work out the problem. … I speak without exaggeration when I say that I have constructed 3,000 different theories in connection with the electric light, each one of them reasonable and apparently likely to be true. Yet only in two cases did my experiments prove the truth of my theory. My chief difficulty was in constructing the carbon filament. . . . Every quarter of the globe was ransacked by my agents, and all sorts of the queerest materials used, until finally the shred of bamboo, now utilized by us, was settled upon.
On his years of research in developing the electric light bulb, as quoted in “Talks with Edison” by George Parsons Lathrop in Harpers magazine, Vol. 80 (February 1890), p. 425
So when we encourage kids to be creative, we must also understand the importance of all the content and practice necessary to creatively breakthrough. Edison was taught how to be methodical, critical, and observant. He understood the known patterns and made variations. It is important to know the known forms to know the importance of breaking forms. This may inv0lve copying someone else’s design or ideas. Thomas Edison also speaks to this when he said:
Everyone steals in commerce and industry. I have stolen a lot myself. But at least I know how to steal.
Edison stole ideas from others, (just as Watson and Crick were accused of doing). The point Watson seems to be making here is that he knew how to steal, meaning, he saw how the parts fit together. He may have taken ideas from a variety of places, but he had the knowledge, skill, and vision to put them together. This synthesis of ideas took awareness of the problem, the outcome, and how things might work. Lots and lots of experience and practice.
To attain this level of knowledge and experience, perhaps stealing ideas, or copying and imitation are not a bad idea for classroom learning? However copying someone else in school is viewed as cheating rather than a starting point. Perhaps instead, we can take the criteria of examples and design classroom problems in ways that allow discovery and the replication of prior findings (the basis of scientific laws). It is often said that imitation is the greatest form of flattery. Imitation is also one of the ways we learn. In the tradition of play research, mimesis is imitation–Aristotle held that it was “simulated representation”.
The Role of Play and Games
In close, my hope is that we not use the terms “creativity” and “innovation” as suitcase words to diminish such things as minimum standards. We need minimum standards.
But when we talk about teaching for creativity and innovation, where we need to start is the way that we gather data for assessment. Often assessments are unimaginative in themselves. They are applied in ways that distract from learning, because they have become the learning. One of the worst outcomes of this practice is that students believe that they are knowledgeable after passing a minimum standards test. This is the soft-bigotry of low expectation. Assessment should be adaptive, criteria driven, and modeled as a continuous improvement cycle.
This does not mean that we must  drill and kill kids in grinding mindless repetition. Kids will grind towards a larger goal where they are offered feedback on their progress. They do it in games.
Games are structured forms of play. They are criteria driven, and by their very nature, games assess, measure, and evaluate. But they are only as good as their assessment criteria.
These concepts should be embedded in creative active inquiry that will allow the student to embody their learning and memory. However, many of the creative, inquiry-based lessons I have observed tend to ignore the focus of academic language–the crystallized concepts. Such as, “what is fast?”, “what is beauty”, Â “what is balance?”, or “what is conflict?” The focus seems to be on interacting with content rather than building and chunking the concepts with experience. When Plato describes the world of forms, and wants us to understand the essence of the chair, i.e., “what is chairness?” We may have to look at a lot of chairs to understand chairness. Â Bu this is how we build conceptual knowledge, and should be considered when constructing curriculum and assessment. A guiding curricular question should be:
How does the experience inform the concepts in the lesson?
There is a way to use data-driven instruction in very creative lessons, just like the very unimaginative drill and kill approach. Teachers and assessment coordinators need to take the leap and learn to use data collection in creative ways in constructive assignments that promote experiential learning with crystallized academic concepts.
If you have kids make a diorama of a story, have them use the concepts that are part of the standards and testing: Plot, Character, Theme, Setting, ETC. Make them demonstrate and explain. If you want kids to learn the physics have them make a boat and connect the terms through discovery. Use their inductive learning and guide them to conceptual understanding.This can be done through the use of informative assessments, such as with rubrics and scales for assessment.  Evaluation and creativity are not contradictory or mutually exclusive. These seeming opposites are complementary, and can be achieved through embedding the crystallized, higher order concepts into meaningful work.
 This monograph describes cognitive ethnography as a method of choice for game studies, multimedia learning, professional development, leisure studies, and activities where context is important. Cognitive ethnography is efficacious for these activities as it  assumes that human cognition adapts to its natural surroundings (Hutchins, 2010; 1995) with emphasis on analysis of activities as they happen in context; how they are represented; and how they are distributed and experienced in space. Along with this, the methodology is described for increasing construct validity (Cook and Campbell, 1979; Campbell & Stanley, 1966) and the creation of a nomological network Cronbach & Meehl (1955). This description of the methodology is contextualized with a study examining the literate practices of reluctant middle school readers playing video games (Dubbels, 2008). The study utilizes variables from empirical laboratory research on discourse processing (Zwann, Langston, & Graesser, 1996) to analyze the narrative discourse of a video game as a socio-cognitive practice (Gee, 2007; Gee, Hull, & Lankshear, 1996).
Keywords:
Cognitive Ethnography, Methodology, Design, Game Studies, Validity, Comprehension, Discourse Processing, Reading, Literacy, Socio-Cognitive.
INTRODUCTION
As a methodological approach, cognitive ethnography assumes that cognition is distributed through rules, roles, language, relationships and coordinated activities, and can be embodied in artifacts and objects (Dubbels, 2008). For this reason, cognitive ethnography is an effective way to study activity systems like games, models, and simulations –whether mediated digitally or not.
BACKGROUND
In its traditional form, ethnography often involves the researcher living in the community of study, learning the language, doing what members of the community do—learning to see the world as it is seen by the natives in their cultural context, Fetterman (1998).
Cognitive ethnography follows the same protocol, but its purpose is to understand cognitive process and context—examining them together, thus, eliminating the false dichotomy between psychology and anthropology.
Observational techniques such as ethnography and cognitive ethnography attempt to describe and look at relations and interaction situated in the spaces where they are native. There are a number of advantages to both laboratory observation and in the wild as presented in Figure 1.
NOMOLOGICAL NETWORK
As mentioned, Cognitive Ethnography can be used as an attempt to provide evidence of construct validity. This approach, developed by Cronbach & Meehl (1955), posits that a researcher should provide a theoretical framework for what is being measured, an empirical framework for how it is to be measured, and specification of the linkage between these two frameworks. The idea is to link the conceptual/theoretical with the observable and examine the extent to which a construct, such as comprehension, behaves as it was expected to within a set of related constructs. One should attempt to demonstrate convergent validity by showing that measures that are theoretically supposed to be highly interrelated are, in practice, highly interrelated, and, that measures that shouldn’t be related to each other in fact are not.
This approach, the Nomological network is intended to increase construct validity, and external validity, as will be used in the example, the generalization from one study context, such as the laboratory, to another context, i.e., people, places, times. When we claim construct validity, we are essentially claiming that our observed pattern — how things operate in reality — corresponds with our theoretical pattern — how we think the world works. To do this, it is important to move outside of laboratory settings to observe the complex ways in which individuals and groups adapt to naturally occurring, culturally constituted activities.  By extending theory building with different approaches to research questions, and move from contexts observed in the wild, then refined in the laboratory, and then used as a lens in field observation.
The pattern fits deductive/ inductive framework:
- Deductive: theory, hypothesis, observation, and confirmation
- Inductive: observation, pattern, tentative hypothesis,
These two approaches to research have a different purpose and approach. Most social research involves both inductive and deductive reasoning processes at some time in the project. It may be more reasonable to look at deductive/inductive approaches as a mixed, circular approach. Since cognition can be seen as embodied in cultural artifacts and behavior, cognitive ethnography is an apt methodology for the study of learning with games, in virtual worlds, and the study of activity systems, whether they are mediated digitally or not. By using the deductive/inductive approach, and expanding observation, one can contrast and challenge theoretical arguments by testing in expanded context.
 Cognitive ethnography emphasizes inductive field observation, but also uses theory in a deductive process to analyze behavior. This approach is useful to increase external validity, operationalize terms, and develop content validity through expanding a study across new designs, across different time frames, in different programs, from different observational contexts, and with different groups (Cook and Campbell, 1979; Campbell & Stanley, 1966).
More specifically, cognitive ethnography emphasizes observation and key feature analysis of space, objects, concepts, actions, tools, rules, roles, and language. Study of these features can help the researcher determine the organization, transfer, and representation of information (Hutchins, 2010; 1995).
Ontology/Purpose
As stated, cognitive ethnography assumes that human cognition adapts to its natural surroundings. Therefore, the role of cognitive ethnographer is to transform observational data and interpretation into meaningful representations so that cognitive properties of the system become visible (Hutchins, 2010; 1995).
According to Hutchins (2010) study of the space where an activity takes place is a primary feature of observation in cognitive ethnography. He lists three kinds of important spaces for consideration (See Figure 2)
APPLICABILITY
Just as a book is organized to present information, games also structure narratives, and are themselves cultural artifacts containing representation of tools, rules, language, and context (Dubbels, 2008). This makes cognitive ethnography an apt methodology for the study of games, simulations, narrative, and human interaction in authentic context.
Because this emphasis on space is also indicative of current approaches to literacy (Leander, 2002; Leander & Sheehy, 2004); as well as critical science and the studied interaction between the internal world of the self and the structures found in the world, and how we communicate about them (Soja, 1996; Lefebvre, 1994); also from the tradition of ecological views on cognitive psychological perspectives (Gibson, 1986),; and in the case of the example, Discourse Processing (Zwaan, Langston, & Graesser, 1996). Because of the emphasis in ontology and purpose of the method align so closely with the variables identified in the Discourse Processing model (Zwann, Langston, & Graesser, 1996), it was applicable as a methodological approach to create a convergence of theory and tradition predicated upon an approach that aligns in purpose with analysis and question.
EXAMPLE
As an example, Dubbels (2008) used cognitive ethnography to observe video game play at an afterschool video game club. The purpose of this observation was to explore video game play as a literate practice in an authentic context. The cognitive ethnography methodology was recruited to utilize peer reviewed empirical research from laboratory studies—utilizing narrative discourse processing to interpret the key variables—to extend construct validity and observe whether the laboratory outcomes appeared in authentic, native contexts.
This allowed the researcher to interpret observations of authentic video game play in an authentic space through the lens of empirical laboratory work at an afterschool video game club.
Guiding question
The focus on space and social context, and the methodology for this example of cognitive ethnography explored a statement from O’Brien & Dubbels (2004, p. 2),
Reading is more unlike the reading students are doing outside of school than at any point in the recent history of secondary schools, and high stakes, print-based assessments are tapping skills and strategies that are increasingly unlike those that adolescents use from day to day.
These day-to-day skills and strategies were viewed as literate practice and theoretically.
They led to the guiding question:
- Can games be described as a literate practice as has been described by theoreticians?
If so, this should be apparent through:
- Observing game play
- Understanding the game narrative and controls,
- And doing analysis of interaction and behavior. Â Â Should the words behind the bullets be capitalized since you have it in sentence form?
Hypothesis
The guiding question: whether games could be viewed as a literate practice was extended to create a hypothesis to test:
- Can the literate practice of gaming be used to facilitate greater success with printed text?
The hypothesis would be tested through examination of game play narratives and printed text narratives—as described in the Nomological network section; this would be an deductive/inductive process. The use of the variables from the Event Indexing Model could be used for identifying levels of discourse and the ability to create a mental representation after the inductive observation process.
The hypothesis was predicated upon the theory that familiarity with patterns in text, from symbolic representations such as words, sentences, images, and story grammars. The story grammar being “once upon a time,†in a game might be used as a developmental analog to help struggling readers predict the structure and purpose of print narratives by helping them to expect certain events, characters, and settings and help the reader to become more efficient. In essence, they would have expectations that “once upon a time†leads to “happily ever afterâ€, and other genre patterns attributable to transmedial narrative genre patterns.
The theory is that a reader may be capable of compensation, i.e., the use genre patterns and predictive inference as higher-level process in order to support lower-level process (Stanovich, 2000). It was proposed that to develop meaningful comprehension, the propositional and situation levels might be built upon for building mental representation of printed narrative text with the game.
Context and Variables for Coding and Analysis
Literate activities were codified based upon a well-established model of discourse processing, The Event Indexing Model (Zwann, Langston, & Graesser, 1996). The Event Indexing Model offered five levels of discourse processing: Surface Level, Propositional Level, Situation Level, Genre Level, and Author Communication.
These levels offer an opportunity to view comprehension as a transmedial trait across discourse. The Situation Level (figure 5) is composed of two sub-levels of the variable. These are aspects of mental representation called the Dimensions of Mental Representation and are composed of: time, space, characters, causation, and goals.  These variables of the discourse-processing model were used to code the transcripts from the game club audio/video games, and context in order to explore the familiarity the students had with patterns in discourse, and their ability to recognize and process them. In order to observe the literate activities of students in their chosen medium, we offered the after school game club to students who had been selected by school district professionals for reading remediation courses outside of the mainstream. The video game play and activity space was analyzed from direct observation and analysis of audio/video recordings and photos taken during the activity.
Conceptual Space Analysis
Walkthroughs of the game were used to look at decision making through navigation of the game.
A Walkthrough, according to Dubbels (in Beach, Anson, Breuch, & Swiss eds, 2009), is a document that describes how to proceed through a level or particular game challenge. Walkthroughs are created by the game developer or players and often include video, audio, text, and static images—offering strategies, maps through levels, the locations of objects, and important and subtle elements of the game.
In order to have a thorough understanding of possible the goals, actions, and behaviors available in the game, a number of walkthroughs were analyzed along with the game controls, and maps for optimal play—Figure 4.

Physical Space Analysis
To create the cognitive ethnography of the video game play, two video captures were used: one to record the screen activity, and one to record player interaction with the game and play space. Because the player of the game was often highly engaged with problem solving and reacting to the game environment, there was often little-to-no dialog or variation in expression and body language – however, play was often done in the company of others. This was informative as the discussion, encouragement, and advice displayed the social and cultural knowledge of the strategies of game play. In addition, a still camera was made available for the students to take pictures for their club. This included digital pictures of the games screens and each other playing, or whatever they felt was interesting.
Social Space Analysis
The audio and video, and still images were used for analysis of the social space, as well as the physical space. However, another level of data collection involved showing the player the video recording of their play and action in the room were used for a “reflect aloud†(Ericsson & Simon, 1983) for them to describe their play and social interaction. The key feature was not only observing the play, but also identifying theories of relationships, cognition and social learning—“what were you thinking there?†was the main question asked. This dialogue served to explain the player’s reasoning and decisions without overt interpretation by the observer. This enhanced the description, and connected the naturalistic game play to the laboratory, and then back to behavior in the wild.
It was this exploration of theory that led to the study of struggling readers using video games as methods for observing levels of mental representation and recall in game play and reading. Using the Cognition Ethnographic approach allowed for comparison of students observed playing video games with friends, the dialog and behaviors that constituted game play as a literacy (Gee, 2007; Gee, Hull, & Lankshear, 1996.) and their formal academic reading behaviors. Because the boys were observed in a formal laboratory setting, it was possible to make comparisons of their game play in the informal, or wild, autonomy supporting space.
Examples of Analysis
An example of the game play observation comes from Dubbels (2008, p. 265):
Since Darius seemed to know what he was talking about, he went next, and as he played, the other boys watched and were excited with what Darius was able to do. Darius seemed happy to demonstrate what he knew. While I was recording, the boys described Darius’ play and shared ideas enthusiastically about how the game worked and looked forward to their chance to play. As Darius made a move where he showed how to do a double bomb jump, the boys watched intently. The way it was explained was that you lay a bomb, and right before that bomb explodes, set a second one, then set a third just before you reach the very top of the jump. You should fall and land said the easiest way “is to count out: 1, 2, 3, 4.â€
And he laid the bombs on 1, 3, and 4. The boys were excited about this, as well as Darius’ willingness to show them. What was clear was that Darius had not only had played the game before, and as I questioned him more later I found that he had read about it and applied what he had read. He had performed a knowledge act demonstrating comprehension.
The other boys were eager to try some of the things Darius had shown them, and Darius was happy to relinquish the controller. What happened from there was that Darius watched for a while and then walked over to the Xbox, and then to the bank of computers. I left the camera to record the boys paying Metroid Prime and I walked over to see what Darius was doing. He showed me a site on the Internet where he was reading about the game. He had gone to a fan site where another gamer had written a record of what each section of the game was like, what the challenges were, cool things to do, and cool things to find. I asked him if this was cheating; he said “maybe†and smiled. He said that it made the game more fun and that he could find more “cool stuff†and it helps him to understand how to win easier and what to look for.
This idea of secondary sources to better understand the game makes a lot of sense to me. It is a powerful strategy that informs comprehension as described previously in this chapter. The more prior knowledge a person has before reading or playing, the more likely they are to comprehend it fully. Secondary sources can help the player by supporting them in preconceiving the dimensions of Level 3 in the comprehension model, and with that knowledge, the player may have an understanding of what to expect, what to do, and where to focus attention for better success. Darius has clearly displayed evidence that he knows what it takes to be a competent comprehender He had clearly done the work in looking for secondary sources and was motivated to read with a specific purpose—to know what games he wants to try and to be good at those games. His use of secondary sources showed that he was able to draw information from a variety of sources, synthesize them, and apply his conclusion with practice to see if it works.
One of the key features of the cognitive ethnography is the realization that even the smallest of human activities are loaded with interesting cognitive phenomena. In order to do this correctly, one should choose an activity setting for observation, establish rapport, and record what is happening to stop the action for closer scrutiny. This can be done with photos, video, audio recording, and notebook. The key feature is event segmentation, structure in the events, and then interpretation.
As was presented in the passage from Dubbels (2008), analysis was done describing the social network surrounding the game play of one boy describing the different spaces, and the behaviors of the boys surrounding him. The link to game play and strategy for successfully navigating the video game can be considered an analog to how young people read print text when a model is used as a framework for analysis.
One can then connect the cultural organization with the observed processes of meaning making. This allows patterns and coherence in the data to become visible through identification of logical relations and cultural schemata. This allowed for description of engaged learning when the video students approached the game, their social relations, and how they managed the information related to success in the game, reading the directions, taking direction from others, secondary sources, and development of comprehension during discourse processing compared to the laboratory setting.
In order to see if there was transfer, students were asked to work with the investigator in a one-on-one read aloud in a laboratory setting. The student was asked to read a short novel, Seed People, to the investigator for parallels and congruency between interaction of narratives found in game play, and traditional print-based narratives found in the classroom.
What I noticed in talking to them about Seed People was that they would read without stopping. They would just roll right through the narrative until I would ask them to stop and tell me about what they thought was going on, with no thought of looking at the situations and events that framed each major scene, and then connecting these scenes as a coherent whole as is described earlier in the chapter as an act of effective comprehension.
In one case Stephen made interesting connections between what he saw with an older boy in the story and the struggles his brother was having in real life. I just wondered if he would have made that connection if I had not stopped at the close of that event to talk about it and make connections. This ability to chunk events and make connections, as situations change and the mental representation are updated, is important for transition points in the incremental building of a comprehensive model of a story or experience.
When working to teach reading with this information, it is important to connect to prior knowledge and build and compare the new information to prior situation models or prior experience. Consider a storyboard or a comic strip where each scene is defined and then the next event is framed. Readers need to learn to create these frames when comprehending text. Each event in a text should then be integrated and developed as an evolution of ideas presented as each scene builds with new information; the model is updated and expanded.
If the event that is currently being processed overlaps with the events in working memory on a particular dimension, then a link between those events is established, then a link between those events is stored in long-term memory. Overlap is determined based on two events sharing an index (i.e., a time, place, protagonist, cause, or goal). (Goldman, Graesser, & van den Broek, 1999, p. 94)
In this instance with Stephen, there were many opportunities for analysis with the spaces described by Hutchins. The boy made connections to family outside of the novel, to his brother, to make it meaningful and also chunk a large section of the book as an event he could relate to. There was also the description of the setting, where Stephen was not pausing or processing the narrative in his reading. The activity did not include any social learning or modeling from friends and contemporaries, but resonated the controlled formal environment of school.
Thus, it was concluded that we must build our understanding in multiple spaces. The attributes of the situation model were made much more robust and much more easily accessible when prior knowledge was recruited and connected with the familiar..
Two types of prior knowledge support this in the Event Indexing Model:
• General world knowledge (pan-situational knowledge about concept types, e.g., scripts, schemas, categories, etc.), and
• Referent specific knowledge (pan-situational knowledge about specific entities).
These two categories represent experience in the world and literary elements used in defining genre and style as described from the Event Indexing Model. The theory posits that if a reader has more experience with the world that can be tapped into, and also knowledge and experience about the structure of stories, he or she is more likely to have a deeper understanding of the passage. In the case of the game players, it was seen to be important for seeking secondary sources, as well as copying the modeled behavior of successful players like Darius and segmenting action into manageable events. This was also evident when the students were asked to read aloud print text from the Seed People novel. The students, like Stephen showed they had difficulty segmenting events, or situations, just like they had difficulty with game play.
Of the fourteen regular students in the club, only two were successful with the games. After further interview and analysis, the two successful gamers, who showed awareness of game story grammar and narrative patterns were found to lack confidence in printed text. However, they were able to leverage the narrative awareness strategies from games to leverage print text form secondary sources in order to help them successfully p;ay the games. Conversely, the twelve students who struggled had to learn the help seeking strategies and narrative awareness.
CONCLUSION
For this study, cognitive ethnography was an appropriate methodology as it allowed for observation and analysis of the social and cultural context to inform the cognitive approach taken by the game players. It improved external validity from the laboratory study by applying the same construct to a new time, place, group, and methodology. The cognitive ethnography methodology presents an opportunity to move between inductive and deductive inquiry and observation to build a Nomological network. The cognitive ethnography methodology can provide opportunity to extend laboratory findings into authentic, autonomy supporting contexts, and opportunities to understand the social and cultural behaviors that surround the activities–thus increasing generalizability. This opportunity to use hypothesis testing in an authentic setting can provide a more suitable methodology for usability and translation for other contexts like the classroom, professional development, product design, and leisure studies.
References
Campbell, D.T., Stanley, J.C. (1966). Experimental and Quasi-Experimental Designs for Research. Skokie, Il: Rand McNally.
Cronbach, L. and Meehl, P. (1955). Construct validity in psychological tests, Psychological Bulletin, 52, 4, 281-302.
Cook, T.D. and Campbell, D.T. Quasi-Experimentation: Design and Analysis Issues for Field Settings. Houghton Mifflin, Boston, 1979)
Deci, E. L., & Ryan, R.M. (1985). Intrinsic motivation and self-determination in human behavior. New York: Plenum Press.
Dubbels, B.R. (2008). Video games, reading, and transmedial comprehension. In R. E. Ferdig (Ed.), Handbook of research on effective electronic gaming in education. Information Science Reference.
Dubbels, B.R. (2009). Analyzing purposes and engagement through think-aloud protocols in video game playing to promote literacy. Paper presented at the National Reading Conference, Orlando, FL.
Dubbels, B. (2009). Students’ blogging about their video game experience.  In R. Beach, C. Anson, L. Breuch, & Swiss, T. (Eds.)  Engaging Students in Digital Writing.  Norwood, MA:
Christopher Gordon.
Ericsson, K., & Simon, H. (1993). Protocol analysis: verbal reports as data (2nd ed.). Boston: MIT Press.
Gee, J. P. (2007). Good video games + good learning. New York: Peter Lang.
Gee, J., Hull, G., and Lankshear, C. (1996). The new work order: Behind the language of the new capitalism. Boulder, CO: Westview.
Gibson, J. J. (1986). The Ecological Approach to Visual Perception. Hillsdale, New
Jersey: Erlbaum
Hutchins, E. (1996). Cognition in the wild. Boston: MIT Press.
Hutchins, E. (2010). Two types of cognition. Retrieved August 15, 2010, from http://hci.ucsd.edu/102b.
Leander, K. (2002). Silencing in classroom interaction: Producing and relating social spaces. Discourse Processes, 34(2), 193–235.
Leander, K., and Sheehy, M. (Eds). (2004). Spatializing literacy research and practice. New York: Peter Lang.
Lefebvre, H. (1991). The production of space. Cambridge, MA: Blackwell.
O’Brien, D.G. & Dubbels, B. (2004). Reading-to-Learn: From print to new digital media and new literacies. Prepared for National Central Regional Educational Laboratory. Learning Point Associates.\
Soja, E. (1989). Postmodern geographies: The reassertion of space in critical social theory. London: Verso.
Soja, E. (1996). Thirdspace: Journeys to Los Angeles and Other Real-and-Imagined Places. Malden, MA: Blackwell.
Stanovich, K.E. (2000). Progress in understanding reading. New York: Guilford Press.
Zwaan, R.A., Langston, M.C., & Graesser, A.C. (1995). The construction of situation models in narrative comprehension: an event-indexing model. Psychological Science, 6, 292-297.
Zwaan, R.A., & Radvansky, G.A. (1998). Situation models in language comprehension and memory. Psychological Bulletin, 123, 162-185.
|
|
Developmental Changes in the Visual Span for ReadingMiYoung Kwon,a Gordon E. Legge,a and Brock R. Dubbelsb
a Department of Psychology, University of Minnesota, Elliott Hall, 75 East River Rd. Minneapolis, MN 55455 USA
b College of Education & Human Development, University of Minnesota, Burton Hall, 178 Pillsbury Dr., Minneapolis MN 55455 USA
Corresponding Author: MiYoung Kwon, 75 East River Rd, Minneapolis, MN, TEL: 612-296-6131; EMAIL:kwon0064@umn.edu
Abstract
1. INTRODUCTION
Children’s reading speed increases throughout the school years. According toCarver (1990), from grade 2 to college, the average reading rate increases about 14 standard-length words per minute1 each year. Learning to read involves becoming proficient in phonological, linguistic and perceptual components of reading (Aghababian, & Nazir, 2000). By age 7, normally sighted children reach nearly adult levels of visual acuity (Dowdeswell, Slater, Broomhall, & Tripp, 1995). By first grade, typically 6 years of age, most of them know the alphabet. Nevertheless, reading speed takes a long time to reach adult levels.
Many studies have addressed potential explanations for developmental changes in reading skills. Because it is often assumed that visual development is complete by the beginning of grade school, most studies have focused on the role of phonological or linguistic skills in learning to read (e.g., Adams, 1990; Goswami & Bryant, 1990;Muter, Hulme, Snowling, & Taylor, 1997). Consistent with this focus, one widely accepted view is that linguistic skills are predictive of reading performance and serve as the locus of differences in reading ability. According to this view, skilled and less skilled readers extract the same amount of visual information during the time course of an eye fixation, but skilled readers have more rapid access to letter name codes (e.g., Jackson & McClelland, 1979; Neuhaus, Foorman, Francis, & Carlson, 2001), make better use of linguistic structure to augment the visual information (Smith, 1971), or process the information more efficiently through a memory system (Morrison, Giordani, & Nagy, 1977) (as cited in Mason, 1980, p. 97). It is further argued that inefficient eye movement control observed in less skilled readers is a reflection of linguistic processing difficulty (Rayner, 1986, 1998) rather than a symptom of perceptual difference per se.
Stanovich and colleagues have critiqued the general view that differences in reading skill are primarily due to top-down linguistic influences. See Stanovich (2000, Ch. 3) for a review. Stanovich (2000) has summarized findings showing that recognition time for isolated words is highly correlated with individual differences in reading fluency. This work has focused interest on the speed of perceptual processing, rather than top-down cognitive or linguistic influences, in accounting for individual differences in normal reading performance. The differences in word-recognition time among normally sighted subjects could be due to differences in the transformation from visual to phonological representations of words, or to differences at an earlier, purely visual, level of representation. In short, it remains plausible that individual differences in reading skill, and also the development of reading skill, are at least partially due to differences in visual processing.
Five lines of evidence implicate vision as a factor influencing reading development. 1) The characteristics of children’s reading eye movements differ from those of adults, showing smaller and less precise saccades than adults (Kowler, & Martins, 1985). 2)Mason and Katz (1976) found that good and poor readers among 6th-grade children differed in their ability to identify the relative spatial position of letters. Farkas and Smothergill (1979) also found that performance on a position encoding task improved with grade level in children in 1st, 3rd and 5th grade. 3) It was found that children’s reading ability was associated with orientation errors in letter recognition such as confusing d and b, or p and q. stressing the role of visual-orthographic skill in reading (e.g., Davidson, 1934, 1935; Cairns, & Setward, 1970; Terepocki, Kruk, & Willows, 2002). 4) More direct evidence for the involvement of visual processing in children’s reading development was obtained by O’Brien, Mansfield and Legge (2005). They observed that the critical print size for reading decreases with increasing age. (Critical print size refers to the smallest print size at which fast, fluent reading is possible.) A similar character-size dependency of reading performance was also observed by Hughes and Wilkins (2000) and Cornelissen et al. (1991). 5) Letter recognition, a necessary component process in word recognition (e.g., Pelli, Farell, & Moore, 2003), is known to be degraded by interference from neighboring letters (Bouma, 1970). This crowding effect decreases with age in school-age children (Bondarko & Semenov, 2005) and is significantly worse in children with developmental dyslexia compared with normal readers (Spinelli, De Luca, Judica, & Zoccolotti, 2002). It should also be noted that there is a related debate in the literature over the role of visual factors in dyslexia, especially the impact of visual processing in the magnocellular pathway. For competing views, see the reviews by Stein and Walsh (1997) and Skottun (2000a; 2000b).
Collectively, the empirical findings briefly summarized above suggest a role for early visual processing in the development of reading skills. The question of whether there is an early perceptual locus for reading differences is an important one to resolve both for a better understanding of the reading process and for remediation purposes. In the present paper, we ask whether vision plays a role in explaining the known developmental changes in reading speed.
Legge, Mansfield and Chung (2001) studied the relationship between reading speed and letter recognition. They proposed that the size of the visual span2 – the range of letters, formatted as in text, that can be recognized reliably without moving the eyes – covaries with reading speed. They also proposed that shrinkage of the visual span may play an important role in explaining reduced reading speed in low vision. Work in our lab has shown that for adults with normal vision, manipulation of text contrast and print size (Legge, Cheung, Yu, Chung, Lee, & Owens, 2007), character spacing (Yu, Cheung, Legge, & Chung, 2007), and retinal eccentricity (Legge, et al., 2001) produce highly correlated changes in reading speed and the size of the visual span.Pelli, Tillman, Freeman, Su, Berger, and Majaj (in press) have recently shown that a similar concept, which they term “uncrowded span,†is directly linked to reading speed. The influential role of the size of the visual span in reading speed was also demonstrated in a computational model called “Mr. Chipsâ€, which uses the size of the visual span as a key parameter (Legge, Klitz, & Tjan, 1997; Legge, Hooven, Klitz, Mansfield, & Tjan, 2002). These empirical and theoretical findings provide growing evidence for a linkage between reading speed and the size of the visual span.
We measured the visual spans of children at three grade levels to examine developmental changes in early visual processing. The size of the visual span was measured using a trigram3 (random strings of three letters) identification task (Legge, et al., 2001). In this method, participants are asked to recognize letters in trigrams flashed briefly at varying letter positions left and right of the fixation point as shown in the top panel of Figure 1. Over a block of trials, a visual-span profile is built up – a plot of letter recognition accuracy (% correct) as a function of letter position left and right of fixation – as shown in the bottom panel of Figure 1. These profiles quantify the letter information available for reading. The method of measurement means that the profiles are largely unaffected by oculomotor factors and top-down contextual factors. Trigram identification captures two major properties of visual processing required for reading: letter identification and encoding of the relative positions of letters.
We distinguish between the concept of the visual span and the concept of the perceptual span (McConkie, & Rayner, 1975). Operationally, the perceptual span refers to the region of visual field that influences eye movements and fixation times in reading. The size of the perceptual span is typically measured using either the moving window technique (McConkie, & Rayner, 1975) or moving mask technique(Rayner, & Bertera, 1979). The perceptual span is estimated to extend about 15 characters to the right of fixation and four characters to the left of fixation. Rayner (1986) argued that the perceptual span reflects readers’ linguistic processing or overall cognitive processing rather than visual processing per se. On the other hand, the visual span is relatively immune to oculomotor and top-down contextual influences, and is likely to be primarily determined by the characteristics of front-end visual processing.
Rayner (1986) measured the size of the perceptual span and characteristics of saccades and fixation times in children in second, fourth and sixth grades, and in adults. He found an increase in the size of the perceptual span and a decrease in fixation times with age. These oculomotor changes could be due to maturation in eye movement control, or to secondary factors influencing eye movement control (either bottom-up visual factors, or top-down cognitive factors). Rayner (1986) attributed the developmental changes in eye movements to top-down cognitive factors because the size of the perceptual span and fixation duration were found to be dependent on the text difficulty. For example, he found that when children in fourth grade were given age appropriate text material, their fixation times and the size of the perceptual span became close to those of adults.
To confirm that oculomotor maturation is not the major source of developmental changes in reading speed, we tested our participants with two types of reading displays. First, Rapid Serial Visual Presentation (RSVP) reading minimizes the need for intra-word reading saccades, and removes the reader’s control of fixation times. Second, in our Flashcard method, participants read short blocks of text requiring normal reading eye movements. If maturation of eye-movement control is an important contributor to the development of reading speed, we would expect to observe a greater developmental effect in flashcard reading compared with RSVP reading. To the extent that growth in the size of the visual span is a contributor to the development of reading speed, we would expect to find a similar positive correlation with reading speed for both types of displays.
We also asked whether letter size affects the size of the visual span. Print size in children’s books is usually larger than for adult books. The typical print size for children’s books ranges from 5 to 10 mm in x-height, equivalent to 0.72 to 1.43 deg at a viewing distance of 40 cm (Hughes & Wilkins, 2002). Hughes and Wilkins (2000)found that the reading speed of children aged 5 to 7 years decreased as the text size decreased below this range while older children aged 8 to 11 years were less dependent on letter size. O’Brien et al. (2005) reported that the critical print size (CPS) decreases with increasing age in school-age children, showing that younger children need a larger print size in order to reach their maximum reading speed than older children. The critical print size (CPS) for adults is close to 0.2° (Legge, Pelli, Rubin & Schleske, 1985; Mansfield, Legge, & Bane, 1996). It has also been observed that the size of the visual span shows the same dependence on character size as reading speed (Legge, et al., 2007). It is possible that the use of larger print in children’s books reflects the need for larger print size to maximize reading speed. In this study, we used two letter sizes −0.25°, which is slightly above the CPS of adults and 1°, which is substantially larger than the CPS. Our goal was to assess the impact of this difference on the size of the visual span and reading speed for children.
We summarize the goals of this study as follows:
First, we hypothesize that developmental changes in the size of the visual span play a role in the developmental increase in reading speed. To test this hypothesis, we measured the size of the visual span and reading speed for children at three grade levels4 (3rd, 5th and 7th) and for young adults. A testable prediction of the hypothesis is that the visual span increases in size with age and is positively correlated with reading speed.
Secondary goals were to 1) examine the effect of letter size on the development of the visual span; and 2) to assess the influence of oculomotor control with a comparison of RSVP and flashcard reading.
2. METHODS
2.1. Participants
Groups of 10 children in 3rd, 5th, and 7th grade and 10 adults (college students) participated in this study. The children were recruited from the Minneapolis public schools. They were all screened to have normal vision and to be native English speakers. Students with reading disabilities, speech problems or cognitive deficits were excluded. Cooperating teachers at the schools were asked to select students in each grade level to approximately match students for IQ and academic standing across grade levels. Ten college students were recruited from the University of Minnesota with the same criteria. For each participant, visual acuity and reading acuity were assessed with the Lighthouse Near Acuity Test and MNREAD chart respectively. Proper refractive correction for the viewing distance was made. All participants were paid $10.00 per hour. Informed consent was obtained from parents or the legal guardian in addition to the assent of children in accordance with procedures approved by the internal review board of the University of Minnesota. The mean age, visual acuity, and gender ratio for participants in the different grades are provided in Table 1.
2.2. Stimuli
Trigrams, random strings of three letters, were used to measure visual-span profiles. Letters were drawn from the 26 lowercase letters of the English alphabet (repeats were possible). By chance some of the trigrams are three-letter English words (e.g. dog, fog) which might be easier to recognize. However, the chance of getting a word trigram is less than 2% which is not likely to have much influence on the overall letter recognition accuracy (c.f. Legge et al., 2001).
All letters were rendered in a lower case Courier bold font (Apple Mac) – a serif font with fixed width and normal spacing. The letters were dark on a white background (84 cd/m2) with a contrast of about 95%. Letter size is defined as the visual angle subtended by the font’s x-height. The x-height of 0.25° and 1° character size corresponded to 6 pixels and 24 pixels. The viewing distance for all testing was 40cm. The same font was used for measuring reading speeds (see below).
The stimuli were generated and controlled using Matlab (version 5.2.1) and Psychophysics Toolbox extensions (Brainard, 1997; Pelli, 1997). They were rendered on a SONY Trinitron color graphic display (model: GDM-FW900; refresh rate: 76 Hz; resolution: 1600×1024). The display was controlled by a Power Mac G4 computer (model: M8570).
Oral reading speed was measured with two methods–Rapid Serial Visual Presentation (RSVP) and a static text display (Flashcard). The pool of test material consisted of 187 sentences in the original MNREAD format developed for testing reading speed by Legge, Ross, Luebker and LaMay (1989). All the sentences were 56 characters in length. In the Flashcard presentation, the sentences were formatted into four lines of 14 characters (Fig. 2.b.).
The mean word length was 3.94 letters and 93% of the 1581 unique words occur in the 2000 most frequent words based on The Educator’s Word Frequency Guide(Zeno, Ivens, Millard, & Duvvuri, 1995). Mean difficulty of the sentences in the pool was 4.77 (Gunning’s Fog Index), and 1.34 (Flesh-Kincaid Index). According toCarver’s (1976) formula5, the mean difficulty level is below 2nd grade level. Allowing for differences in these metrics, the difficulty of the sentences is roughly 2nd to 4thgrade level. Sample sentences are presented in Figure 2.c. We divided the sentence pool into three sub-pools so that there were separate, non-overlapping sets of sentences for RSVP, Flashcard, and practice. Sentences were selected randomly without replacement, so that no subject saw the same sentence more than once during testing.
2.3. Measuring Visual-Span Profiles
Visual-span profiles were measured using a letter recognition task, as described in the Introduction. Trigrams were presented with their middle letter at 11 letter positions, including 0 (the letter position at fixation) and from 1 to 5 letter widths left and right of the 0 position. Trigram position was indexed by the middle letter of the trigram. For instance, a trigram abc at the position +3 had the b located in position 3 to the right of the 0 letter position, and a trigram at position −3 had its middle letter three letter positions to the left.
Each of the 11 trigram positions was tested 10 times, in a random order, within a block of 110 trials. The task of the participant was to report the three letters from left to right. A letter was scored as being identified correctly only if its order within the trigram was also correct. Feedback was not provided to the participants about whether or not their responses were correct.
Participants were instructed to fixate between two vertically separated fixation points (Fig. 1) on the computer screen during trials. Since there was no way of predicting on which side of fixation the trigram would appear, and the exposure time was too brief to permit useful eye movements, the participants understood that there was no advantage to deviate from the intended fixation. All participants had practice trials in the trigram test, RSVP test and Flashcard test prior to data collection. Participants were verbally encouraged to fixate carefully between the dots at the beginning of a trial.
Proportion correct recognition was measured at each of the letter slots and combined across the trigram trials in which the letter slot was occupied by the outer (the furthest letter from fixation), middle, or inner (the one closest to fixation) letter of a trigram. This means that although trigrams were centered at a given position only 10 times in a block, data from that position were based on 30 trials. As described in the Introduction, a visual span profile consists of percent correct letter recognition as a function of position left and right of fixation. These profiles are fit with “split Gaussiansâ€, that is, Gaussian curves that are characterized with amplitude (the peak value at letter position 0), and the left and right standard deviations (the breadth of the curve). These profiles usually peak at the midline and decline in the left and right visual fields. The profiles are often slightly broader on the right of the peak (Legge et al., 2001).
As described in the Introduction and illustrated in Figure 1 (i.e., the right vertical scale), percent correct letter recognition can be linearly transformed to information transmitted in bits. The information values range from 0 bits for chance accuracy of 3.8% correct (the probability of correctly guessing one of 26 letters) to 4.7 bits for 100% accuracy (Legge et al., 2001)6. The size of the visual span is quantified by summing across the information transmitted in each slot (similar to computing the area under the visual-span profile). Lower and narrower visual span profiles transmit fewer bits of information. In the Results, the size of the visual span will be quantified in units of bits of information transmitted.
Visual-span profiles were measured for each participant at two letter sizes (0.25° and 1°). In both cases, the stimulus exposure time was 100ms. The order of the two conditions was interleaved both within participants and across participants (e.g. participant A started with 1° letter size while participant B started with 0.25° letter size, and so on).
2.4. Measuring Reading Speed
Oral reading speed was measured with two testing methods: Rapid Serial Visual Presentation (RSVP) and static text (Flashcard method). For both testing conditions, the method of constant stimuli was used to present sentences at five exposure times in logarithmically spaced steps, spanning ~ 0.7 log units. For both reading speed tasks, the two letter size conditions were interleaved. The testing session was preceded by a practice session. During this session, the range of exposure times for each participant was chosen in order to make sure that at least 80% correct response (percent of words correct in a sentence) was obtained at the longest exposure time.
For RSVP, the sentences were presented sequentially one word at a time at the same screen location (i.e., the first letter of each word occurred at the same screen location). There was no blank frame (inter-stimulus interval) between words. Each sentence was preceded and followed by strings of x’s as shown in Figure 2.a. In the Flashcard reading test, an entire sentence was presented on the screen as shown inFigure 2.b.
For both tasks, participants initiated each trial by pressing a key. They were instructed to read the sentences aloud as quickly and accurately as possible. Participants were allowed to complete their verbal response at their own speed, not under time pressure. A word was scored as correct, even if given out of order, e.g., a correction at the end of a sentence, the number of words read correctly per sentence was recorded. Five sentences were tested for each exposure time and percent correct word recognition was computed at each exposure time.
Psychometric functions, percent correct versus log RSVP or log Flashcard exposure times, were created by fitting these data with cumulative Gaussian functions (Wichmann, & Hill, 2001a) as shown in Figure 3. The four panels represent four sets of data from RSVP and Flashcard tasks at two letter sizes. Five data points in each panel represent percent words correct in a sentence for RSVP and for Flashcard. The threshold exposure time, for words of a given length was based on the 80% correct point on the psychometric function. For example, in RSVP, if an exposure time of 200 msec per word yielded 80% correct, the reading rate was 5 words per second, equals to 300 wpm. For Flashcard, if the exposure time was 2 sec and the participant read 8 words correctly out of ten, the corresponding reading speed was 4 words per second, equals to 240 wpm.
3. RESULTS
Three dependent variables were measured: the size of the visual span, RSVP reading speed and flashcard reading speed. We conducted one ANOVA test for each measure. The grade level (3rd, 5th, 7th, and Adult) was treated as a categorical variable rather than numerical variable for the statistical analysis.
A 4 (grade) × 2 (letter size) repeated measures ANOVA with grade as a between-subject factor and letter size as a within-subject factor was tested on the size of the visual span. There was a significant main effect of grade level on the size of the visual span (F(3,36) = 9.54, p < 0.001). There was a significant interaction effect between grade level and letter size (F(3,36) = 3.46, p = 0.02). But no significant main effect of letter size on the size of the visual span was found.
A 4 (grade) × 2 (letter size) repeated measures ANOVA with grade as a between-subject factor and letter size as a within-subject factor was tested on RSVP and flashcard reading speeds separately. There was a main effect of grade level on RSVP reading speed (F(3, 36) = 7.80, p < 0.001) and Flashcard reading speed (F(3, 36) = 9.35, p < 0.001). No significant letter size effects on reading speed were found.
The effect of grade level on the size of the visual span and reading speed
The 4 × 2 repeated measure ANOVA test showed that there was a significant main effect of grade on the size of the visual span (η2 = 0.44, p < 0.01). A pairwise contrast test also showed that there were significant differences in the size of the visual span among all pairs of grades except between 3rd and 5th grades. The mean size of the visual span averaged across two letter sizes for the 10 participants is plotted for each grade in Figure 4. These results show that the visual span grows in size from 3rd grade (mean = 34.28 ± 1.17 bits) to adults (mean = 41.66 ± 0.87 bits). The effect size (using Cohen’s d) of the difference in the size of the visual span between 3rd grade and adults equals to 2.28.
We also found that there was a significant main effect of grade level on both RSVP (η2 = 0.39, p < 0.01) and Flashcard (η2 = 0.44, p < 0.01) reading speeds. Figure 5shows RSVP (left panel) and Flashcard (right panel) reading speeds (wpm) as a function of grade level. Open circles in both panels represent reading speeds for 1° letters, and the closed circles for 0.25° letters. Each data point represents the mean reading speed averaged across two letter sizes for a single participant.
As shown in Figure 5, there was a linear increase in both RSVP and flashcard reading speeds with grade level. As expected from prior research, RSVP reading speed was faster than Flashcard reading speed for all groups by an average factor of 1.58, which is fairly consistent with the results (i.e. a factor of 1.44) for a similar comparison by Yu et al. (2007). The growth in RSVP reading speed across grades exceeds the growth in flashcard reading speed, confirming the view that maturation of the oculomotor system is not a major factor associated with the growth in children’s reading speed.
The increment in flashcard reading speed per grade was consistent with earlier studies of page reading speed (Taylor, 1965; Carver, 1990; Tressoldi, Stella, & Faggella, 2001). Carver (1990) estimated that the growth in reading speed was 14 standard-length words per minute per grade level (where one standard-length word is equivalent to 6 characters). The average increment for Flashcard reading speed in our study was approximately 18 words per minute each year and its transformed value into Carver’s metric is 14 wpm, equal to Carver’s estimate.
Relationship between the size of the visual span and reading speed
Flashcard and RSVP reading speeds are plotted against the size of the visual span for our forty participants in Figures 6 and ​and77 respectively. The closed circles, open circles, closed squares, and open squares show data for 3rd, 5th, 7th grade, and adults respectively. The best-fitting lines for predicting reading speed from the size of the visual span are also shown.
There were significant correlations between the size of the visual span and Flashcard reading speed (r = 0.72, p < 0.01), and RSVP reading speed (r = 0.58, p = 0.01).
From the regression model for flashcard reading (Fig. 6), 52% of the variability of the reading speed can be accounted for by the size of the visual span (r2 = 0.52, p < 0.01). The slope of the regression line indicates that an increase in the size of the visual span by 1 bit brings about an increase in reading speed by 22 wpm. The effect size (Cohen’s d) is 2.29 for the difference in flashcard reading speed between 3rd graders and adults. Similarly, from the regression model for RSVP reading (Fig. 7), 33% of the variability of the reading speed can be accounted for by the size of the visual span (r2 = 0.34, p < 0.01). The slope of the regression line indicates that an increase in the size of the visual span by 1 bit brings about an increase in reading speed by 28 wpm. The effect size (Cohen’s d) is once again 2.29 for the difference in RSVP reading speed between 3rd graders and adults.
As described in the Methods section, reading speed was derived from the stimulus exposure time yielding 80% correct word recognition. To determine if the results were sensitive to this criterion, we reanalyzed the data with 70% and 90% criteria for defining reading speed. We found that the relationship between reading speed and the size of the visual span was not criterion dependent – correlations between size of the visual span and reading speed remained approximately the same across all three criteria (less than 0.01 differences in correlations).
The effects of letter size on the visual span and reading speed
We did not find a significant main effect of letter size on either the visual span or reading speeds in children. Contrary to the possibility raised in the Introduction, it does not appear that the use of larger print size in children’s books can be explained in terms of optimizing the size of the visual span.
While children in all three grade levels showed no dependence of letter size on the size of the visual span, adults showed slightly larger visual spans for 0.25° letters than for 1° letters (~ 3 bits). Legge et al. (2007) studied the effect of character size on the size of the visual span for a group of five young adults. They did not find a significant difference in the size of the visual span between 0.25° and 1°. We are unsure of the reason for the small discrepancy in the two studies.
4. DISCUSSION
Relationship between reading speed and the size of the visual span
It is obvious that visual processing is critical to print reading. It is not so obvious that individual differences in reading speed are linked to differences in visual processing nor that developmental changes in reading speed are influenced by visual factors. We have taken the theoretical position that front-end visual processing influences letter recognition which in turn influences reading speed. We have measured letter recognition in the form of visual-span profiles. The shape and size of these profiles are largely immune to top-down contextual factors and to oculomotor factors, and represent the bottom-up sensory information available to letter recognition and reading. The size of these profiles has been previously linked empirically and theoretically to reading speed (Legge, Mansfield & Chung, 2001;Â Legge et al., 2007). More specifically, it is hypothesized that the size of the visual span is an important determinant of reading speed.
As reviewed in the Introduction, it is known that children’s reading speed gradually increases throughout the school years (cf., Carver, 1990). The principal goal of our study was to determine whether visual development has an impact on this improvement in reading speed. We addressed this question by measuring changes in the size of the visual span across grade levels. Our hypothesis was that the size of the visual span would increase with grade level, and exhibit a correlation with reading speed.
These predictions were confirmed by our results. We found that there was a developmental growth in the size of the visual span from 3rd grade to adulthood paralleling growth in reading speed. A statistically significant 34% to 52% of the variance in reading speed could be accounted for by the size of the visual span.
Why does a larger visual span facilitate faster reading? For eye-movement mediated reading of lines of text on a page or screen (such as the flashcards in the present study), a larger visual span means that more letters can be recognized accurately on each fixation. With a larger visual span, longer words might be recognized on one fixation, or more letters of an adjacent word might be recognized if the fixated word is short (parafoveal preview). The effects of changing the size of the visual span were explored using an ideal-observer model, called Mr. Chips, by Legge, Klitz and Tjan (1997). Because a larger visual span means that more letters are recognized, the reader is able to make larger saccades; the greater mean saccade length facilitates faster reading. In the case of RSVP reading, there is no need for intra-word saccades or parafoveal preview of the leading letters of the next word. Only one word is visible at a time. In this case, we might speculate that the visual span need only be large enough to accommodate mean word length of the text (3.94 letters in the present study) or possibly the longest word in the text (8 letters in our text). If so, we might expect a weaker effect of visual-span size on RSVP reading speed, and possibly a ceiling once the visual span exceeded some critical value. These effects are not evident in the present data. Growth of the visual span manifests as both an increase in the breadth of visual-span profiles and also an increase in the height of the profiles, i.e., increasing letter-recognition accuracy in the central portion of the profile. The increased height of the profile could contribute to faster and more accurate recognition, even of relatively short strings. In other words, the graded form of the visual-span profile, and its potential growth in both height and breadth, can contribute to faster reading for both flashcard and RSVP text.
We recognize that our results are correlational in nature. It is possible that independent factors could drive the developmental changes in reading speed and size of the visual span. Although a causal link between the size of the visual span and reading speed remains to be proven, stronger evidence for a causal link has been provided by Legge, Cheung, Yu, Chung, Lee & Owens, 2007). These authors have amassed convergent data from several experiments on adults showing that the size of the visual span and reading speed vary in a highly correlated way in response to changes in stimulus parameters such as contrast and character size. For example, it is known that the dependence of reading speed on character size exhibits a nonmonotonic relationship in which reading speed has a maximum value for a range of intermediate character sizes, and decreases for larger and smaller character sizes. Legge et al. (2007) showed that the size of the visual span has the same nonmonotonic dependence on character size.
Sensory factors affecting the size of the visual span
What sensory factors might contribute to developmental changes in the size of the visual span? In the Introduction, we mentioned three candidate factors—errors in the relative position of letters in strings, orientation errors such as confusing b with d, and effects of crowding. We briefly comment on additional analyses of our visual-span data to address the roles of these factors.
Errors in relative spatial position (e.g., reporting bqx when the stimulus was qbx), sometimes termed mislocation errors, were evaluated by scoring trigram letter recognition in two ways; by demanding correct relative position for a letter to be correct, or by the more lenient criterion of scoring a letter correct if reported anywhere in the trigram string. The difference in percent correct by these two scoring methods is a measure of the rate of mislocation errors. An one-way ANOVA with grade (3rd, 5th, 7th, and Adult) as a between-subject factor revealed a significant main effect of grade on the rate of mislocation errors (F(3, 36) = 4.55, p < 0.01). The rate of mislocation errors increased with decreasing grade level (mean error rate for 3rd grade = 8.43 ± 1.1% and the mean error rate for adults = 4.25 ± 0.5%). Mislocation errors could be cognitive in origin, resulting from verbal-reporting mistakes, or visual in origin, resulting from imprecise coding of visual position. We think the latter is more likely because we found that the rate of mislocation errors was dependent on visual-field location, increasing at greater distances from fixation. This dependency of mislocation errors on letter position was consistent across all age groups.
We assessed orientation errors by measuring b and d confusions, and also p and qconfusions. Orientation errors are defined when b (or p) is reported instead of d (or p) and vice versa. The number of incorrect responses out of the total number of occurrence of b, p, d, and q is a measure of the rate of orientation errors. An one-way ANOVA with grade as a between-subject factor revealed a significant main effect of grade on the rate of orientation errors (F(3, 36) = 4.98, p < 0.01). Orientation errors decreased with increasing grade level (mean error rate for 3rd grade = 5.85 ± 0.40% vs. mean error rate for adults = 3.79 ± 0.38%). Since these children and adults would typically have no difficulty in distinguishing b from d, or p from q, in an untimed test of isolated letter recognition, we expect that these confusions result from the temporal demands of the trigram task or from adjacency of flanking letters (crowding) and have an impact on the size of the visual span.
In a separate preliminary report, based on this data set, we have shown that a decrease in crowding accounts for at least a portion of the growth in the size of visual span profiles across grade levels (Kwon & Legge, 2006). Pelli et al. (in press)have recently presented compelling theoretical and empirical arguments for the important role of crowding in limiting the size of the visual span (they use the term “uncrowded spanâ€), although they did not address developmental changes in the size of the visual span.
In short, relative position errors, orientation errors and crowding may all play a role in developmental changes in the size of the visual span.
Oculomotor factors
It is also possible that fixation errors could play a role in the observed developmental changes in the size of the visual span. Indeed, it has been reported that children’s fixation stability increases with age from 4 to 15 years (Ygge, et al, 2005). If children erroneously fixated leftward or rightward of the intended location in our trigram task, performance would on average, suffer; the mean distance of trigrams from the fixation point would increase as the size of the fixational error increases. We conducted a simulation analysis to evaluate the impact on the size of the visual span of such fixation errors. The key parameter of the model was the variability in fixation positions, represented by the standard deviation of an assumed Gaussian distribution of fixation locations centered on the correct fixation mark. An average adult visual span was used as an input parameter for each Bernoulli trial to obtain proportion correct for each letter position. Over trials, we computed the size of the visual span in bits of information transmitted. Through 100 repetitions, we obtained the estimates of the size of the visual span for a given fixation error. For example, if the standard deviation was two letter positions (σ = 2), 68% of the fixation points in the simulated trials would lie within ±2 letter positions from the intended fixation mark. As expected the greater the fixation errors (i.e., larger standard deviations), the smaller the size of the resulting visual spans. The simulation results indicated that fixation variability would need to increase from a standard deviation of 0 to more than 3 letter positions to simulate our observed reduction in visual span size from adults to 3rd graders. Moreover, fixation errors of 3 letter spaces for 1° letters would correspond to fixation errors of 12 letter spaces for 0.25° letters, producing devastating effects on the size of the visual span for the smaller print size. Because we did not observe print size effects on the size of the visual span, and because the fixation errors deduced from our simulation seem implausibly large, we doubt that fixation errors account for the developmental differences in the size of the visual span.
We also observed a substantial growth in reading speed across grades even in the RSVP reading where the need for eye movements is minimized. This result also confirms the view that developmental changes in reading speed can not be solely explained by maturation of oculomotor control.
Non-visual factors
Although we have focused on the size of the visual span as a possible factor influencing reading development, our data indicate that this factor accounts for at most 30 to 50% of the variance in reading speeds across grade levels. Non-visual cognitive and linguistic factors must also contribute to developmental changes in reading speed. It is possible that accidental correlations of one of these factors with grade level could masquerade as an effect of visual span. For example, if reading speed is correlated with IQ, and some unknown selection bias resulted in increasing mean IQ across grade level, then IQ might underlie the correlations we found between reading speed and visual span. In the case of IQ, this seems highly unlikely. Although we did not control for or measure the IQ of our subjects, we have no reason to suspect that there were increases in IQ across grade levels. Even if such a sampling bias exists, O’Brien et al. (2005) found no effect of IQ on maximum oral reading speed and critical print size in a group of children (aged 6 to 8) tested with MNREAD sentences similar to those used in the present study.
As another example, it is possible that children’s ability to recognize and speak the words used in our testing material varied across grade levels, accounting for the correlation between reading speed and grade level. For example, if children in the lower grades were unable to recognize and articulate words in the test material, even for unlimited viewing time, the missed words would count as errors in our scoring and result in reduced reading speed. We did not test word decoding skills of our subjects on a standardized test such as the subsets of the Woodcock-Johnson III Cognitive and Achievement Batteries (Woodcock, McGrew, & Mather, 2001). We did, however, screen all of our subjects with the MNREAD acuity chart (for a review of its properties, see Mansfiel & Legge, 2007). This chart, although designed as a test of the effect of visual factors on maximum reading speed, critical print size and reading acuity, uses simple declarative sentences with vocabulary consisting of the 2,000 most frequent words in 1st, 2nd, and 3rd grade text. The sentence material on the MNREAD chart is very similar to the test material in the present study. None of the words was missed or read incorrectly by our children for sentences above their critical print sizes. These observations lead us to conclude that untimed word-decoding skill was not a limiting factor influencing performance across grade levels in our study.
As yet another example of a potential non-visual influence, the oral reporting method used in the trigram task for measuring visual-span profiles might reflect more than the ability to extract visual information. Performance in this task could be influenced by articulation programming, rapid access to letter naming, memory capacity, and reporting accuracy. Many studies using rapid automatized letter naming (RAN) have shown that those component skills are highly correlated with reading performance (e.g., Denckla & Rudel, 1976; Wolf, 1991; Wolf, Bally, & Morris, 1986; Manis, Seidenberg, & Doi, 1999). It is possible that the underlying visual spans are actually stable across school age, but the observed changes in the size of visual-span profiles might be due to some later stages of processing. However, we think this is unlikely. In the trigram task, there was no time pressure to report the letters, so there were no requirements for rapid articulation and no time pressure on access to letter naming codes. It is still possible that younger children might make more phonological errors or transposition errors in reporting due to less efficient memory. Indeed, it is known that overall memory capacity including perceptual-memory improves with increasing age in children (Dempster, 1978; Shwantes, 1979; Ross-sheehy, Oakes, & Luck, 2003). However, convergent evidence has shown that children at the age of 9 are able to hold an average 5 to 6 digits or spatial symbols in their visual memory (e.g., Wilson, Scott, & Power, 1987; Miles, Morgan, Milne, & Morris, 1996). This result suggests that recalling and reporting a triplet of letters is not likely to pose difficulties for the children in our study. Manis et al. (1999) had 1st and 2nd grade students name 50 digits and letters in a random order aloud as rapidly as possible and measured reporting accuracy. They found that the rate of oral reporting errors was less than 2%, suggesting that by the end of first grade, most children know the names of all the letters and are able to report them with high accuracy.
These considerations encourage us to believe that the observed differences in the size of the visual span across age is likely to represent changes in the availability of bottom-up sensory information rather than effects of later stages of processing. Nevertheless, we cannot rule out the possibility that some other uncontrolled cognitive or other non-visual variable accounted for the apparent association between visual span and reading speed across grade levels in our study.
Effect of letter size
Finally, we addressed the effect of letter size. We expected that young children would have larger visual spans and read faster with 1° characters than with 0.25° characters. Contrary to our expectation, we found no effect of character size for either reading speed or visual span in children. Apparently, legibility as assessed by these two measures, does not account for the preference of children for larger print in books. It is possible that developmental changes in the effects of print size on reading speed are complete by 3rd grade (age 8–9 years), accounting for the absence of print size effects in our data. Consistent with this possibility, Wilkins and Hughes (2002) found that younger children aged below 7 showed a significant dependence of reading speed on letter size in the range 0.72 to 1.43 deg at a viewing distance of 40 cm, but older children above 8 years did not. Similarly, O’Brien et al. (2005) showed that critical print size (CPS) decreased with age from 6 to 8 years old, suggesting younger children need larger print to optimize reading performance. Taken together, it may be the case that the dependence of reading speed on print size becomes adult-like by about 8 years of age.
Summary
We summarize our conclusions as follows: 1) The visual span grows in size during the school years. 2) Consistent with the visual-span hypothesis this developmental change in the size of the visual span is significantly correlated with the developmental increase in reading speed. 3) Because both RSVP and flashcard reading speed increase with age, the growth in reading speed is unlikely to be due to oculomotor maturation. 4) We found no evidence that the use of larger print in children’s books reflects faster reading or larger visual spans for large print.
Acknowledgments
We are grateful to students and teachers of the Minneapolis Public Schools for their participation in this study. We thank Beth O’Brien for her helpful advice on the earlier draft of this manuscript. We are also thankful to Sing-Hang Cheung for his help with the design of experiments. We would like to thank anonymous reviewers for their comments on the manuscript. This work was supported by NIH grant R01 EY02934.
Footnotes
1Carver (1977) defined six characters in text (including spaces and punctuation) as one “standard-length word.†Measuring reading speed in standard-length words per minute is a character-based metric. Carver (1990) argued for the advantage of this metric over the common “words per minute†metric for measuring reading speed.
2The term ‘visual span’ was introduced by O’Regan (O’Regan, Levy-Schoen & Jacobs, 1983; O’Regan, 1990,1991). He defined the visual span as the region around the point of fixation within which characters of a given size can be resolved. Empirical studies have shown that normally sighted adults have a visual span of 7–11 letters. For a review, see Legge (2007, Ch. 3).
3Trigrams were used rather than isolated letters because of their closer approximation to English text. Text contains strings of letters. Most letter recognition in text involves characters flanked on the left, right or both sides.
4In this article, school grade levels refer to the American system. The correspondence between grade level and age is as follows: 1st grade (6–7 yrs), 2nd grade (7–8 yrs), 3rd grade (8–9 yrs), 4th grade (9–10 yrs), 5th grade (10–11 yrs), 6th grade (11–12 yrs), 7th grade (12–13 yrs), and 8th grade (13–14 yrs).
5We estimated the grade level from Carver (1976) who expressed the relationship between characters per word (cpw) and difficulty level (DL). According to his formula, the number of characters per word for 1st grade difficulty is approximately 5 cpw including a trailing space after each word, which is slightly above the number of characters per word (4.7 cpw) we used for our reading tasks.
6Percent correct letter recognition was converted to bits of information using letter-confusion matrices byBeckmann (1998).
This is a PDF file of an unedited manuscript that has been accepted for publication. As a service to our customers we are providing this early version of the manuscript. The manuscript will undergo copyediting, typesetting, and review of the resulting proof before it is published in its final citable form. Please note that during the production process errors may be discovered which could affect the content, and all legal disclaimers that apply to the journal pertain.
References
|


Teachers and teacher evaluation may be directly related to a construct from social psychology called Stereotype Threat and the relationship between motivation and teacher professional identities.
Stereotype Threat
Stereotype threat is the fear that we may confirm a negative stereotype about a group we belong to. From the wikipedia, we can read some of the history of the socio-cognitive construct:
In the early 1990s, Claude Steele, in collaboration with Joshua Aronson, performed the first experiments demonstrating that stereotype threat can undermine intellectual performance. . . Overall, findings suggest that stereotype threat may occur in any situation where an individual faces the potential of confirming a negative stereotype. For example, stereotype threat can negatively affect the performance of European Americans in athletic situations[11] as well as men who are being tested on their social sensitivity.[12] The experience of stereotype threat can shift depending on which group identity is salient to the situation. For example, Asian-American women are subject to a gender stereotype that expects them to be poor at mathematics, and a racial stereotype that expects them to do particularly well. Subjects from this group performed better on a math test when their racial identity was made salient; and worse when their gender identity was made salient.[13]

Certain individuals appear to be more likely to experience stereotype threat than others. Individuals who are highly identified with a particular domain appear to be more vulnerable to experiencing stereotype threat. Therefore, students who are highly identified with doing well in school may, ironically, be more likely to underperform when under stereotype threat. A key feature of this phenomena was highlighted by Amanda Schaefer at Slate Magazine. In order to counter stereotype threat, individuals need to experience positive development and build confidence over the course of a semester. Schaefer explains that a slightly better performance on test one leads to greater motivation and thus leads some individuals to work harder. That work then transcends to understanding of the material that then leads to greater confidence and even further motivation.
Teachers and Stereotype Threat
A recent study by the MeLife Foundation identified that teacher morale is at an all time low. This was discussed recently by the New York Times and a blog at Education Week. It would seem that teachers may be in a no-win situation. They are scrutinized for performance, often evaluated by administrators and others who may not be qualified to evaluate teacher performance. When faced with an evaluation, teachers may face serious professional and personal consequences when they do not satisfy criteria in the evaluation rubric, as interpreted by the evaluators. This was very nicely described in an opinion piece at the NY Times, called, Confessions of a Bad Teacher. In this article, the author writes:
I was confused. Earlier last year, this same assistant principal observed me and instructed me to prioritize improving my “assertive voice†in the classroom. But about a month later, my principal observed me and told me to focus entirely on lesson planning, since she had no concerns about my classroom management. A few weeks earlier, she had written on my behalf for a citywide award for “classroom excellence.†Was I really a bad teacher?
In my three years with the city schools, I’ve seen a teacher with 10 years of experience become convinced, after just a few observations, that he was a terrible teacher. A few months later, he quit teaching altogether. I collaborated with another teacher who sought psychiatric care for insomnia after a particularly intense round of observations. I myself transferred to a new school after being rated “unsatisfactory.â€
My belief is that if we are to avoid such things as stereotype threat in evaluating teachers, good administrators use the evaluation processes to support teachers and help them avoid those painful classroom moments — not to weed out the teachers who don’t produce good test scores or adhere to their pedagogical beliefs (Johnson, 2012).
The current culture of teacher quality and evaluation may be leading to issues in how teachers view their professional identities. They may be living two different professional lives–what they believe to work, and what they have to do to make the grade. This may be especially true with innovative teachers, who have to keep their heads down and teach in a way that works for them and leads to results. After I achieving, their  methods may be accepted. This comes from professional pride and ability. The question that must be asked is whether these innovators and creative teachers can document and demonstrate data-driven instruction.  This kind of instruction may not be applicable to generalized teacher quality assessments, because what the teacher is doing is not generally what is seen.  Is it possible an evaluator who is given a rubric is able or capable of making this evident after reviewing the teacher for  55 minutes they spent checking off cells on a rubric-driven evaluation?
 The Jekyll and Hyde Effect
In the Jeckyll and Hyde Effect (Dubbels, 2009), teachers reported themselves in a situation where they had begun creating two different classrooms, two different sets of grade books, and two different teaching identities – culminating in the classroom they show, and the classroom they grow. These teachers had created a duality in professional identity, meaning that they had created different classrooms and identities to fit the expectations of the mandates, district mentors on learning walks, district trainings, and Professional Development Planning, so they could work “under the radar†and “not be hassled.â€
This phenomena seems to accompany most trends of educational reform.  In an article by Lasky (2005), it was posited that we may be destroying the professional identities of teachers by attacking their styles and beliefs about teaching and learning, and perhaps most importantly, their willingness to be vulnerable to reach kids and connect. Teachers expressed that they felt tension as professional educators, and that their beliefs about student learning often contrasted the current beliefs related to the culture of accountability.
According to Lasky (2005), this is not uncommon. In this passage (pg. 905) Lasky quotes and describes a veteran teacher considering leaving the profession because of frustration with “ladder climbersâ€:
Now there are lot of people who think this is a job to go to because the vacations are good, they follow the doctrines, and a lot of good people are leaving. The major message I was receiving was that you could make a difference, and we’re in this together, and it’s up to all of us to make the world a better place, you know, find your niche and dig in. And it was almost your job to do the peace and love thing. But the message now is that there’s no one to take care of you, you’ve got to watch your back, which is sad.
This teacher’s identity and sense of agency were in tension with the changing political landscape of reform. She found that she was not able to trust these people who were not willing to take the ‘‘real risks’’ entailed in teaching. One such risk is expressing one’s vulnerability;  such as knowing and standing up for one’s beliefs, connecting with students and doing all that can be done to help students from failing.
This can lead to a real hindrance in organizational and institutional trust, especially when it comes time for professional development activities that might require learning.  Teachers reported that they had seen “outcomes based education, constructivism, and profiles of learning†come and go. They reported that they had already invested a huge amount of time into these curricular approaches earlier in their careers, and were not willing to invest as heavily now that they had curriculum that worked for them. One teacher spoke of, “ I used to spend my weekends, afternoons, and evenings calling parents and correcting all for a .6 (part-time) placement, and I decided that I was working harder than the students and parents and not getting paid for it.†This teacher’s feeling was repeated throughout interviews with experienced teachers who shared that they had found an approach that they liked and allowed them to have lives outside of the classroom.
Identity and motivation
According to Dubbels (2009), formal learning seems to necessitate trust and identity. For Deci and Ryan (2002) the focus comes from work on motivation of basic psychological needs, with a focus on Autonomy — possibly built from early work by White (1959), where organisms have an innate need to experience competence and agency, and experience joy and pleasure with the new behaviors when they assert competence over the environment . . . what White called effectance motivation. If the individual gets social reinforcement and improved status in a relationship or community, they will be more likely be motivated to engage, and sustain that engagement, (Dubbels, 2009).
In order for a teacher to remain engaged in their profession and care about what is happening, and to sustain engagement , “motivation must be internalized†the teacher needs to identify the value of the behavior with other values that are part of themselves (Dubbels, 2009).  This internalization is recognized by others, and can be rewarded, ignored, or punished by the professional community, the students and parents, and administration and mentors for professional development. The same factors that we ask teachers to take into account for their classroom students are also at play in developing teacher professional development. This process of change includes public acknowledgement and awareness of making personal and professional change, and this public behavior can expose the individual to being vulnerable to the perceptions and judgment of others.
When a serious game is commissioned, it is expected that in-game learning should transfer to the work place or a clinical setting, not just lead to improvements in game play.

Evidence of transfer should be a priority in serious game development; there should be evidence that learning acquired in a game is applicable outside of the game.
The Vegas Effect is not unique to games; however, serious games will need to provide evidence that learning that happens in games, does not stay in games.
The tradition of psychometrics may provide methods for data collection and analysis so that serious games may eventually serve as empirically validated diagnostic tools and measures of learning—applicable inside and outside of the game. With tools for measuring training effectiveness from psychometrics, ROI analysis of training solutions and clinical tools can be conducted, and the risk associated with the costs of game development may be diminished.
Serious games and assessment
Serious games are very much like the tools used in psychological assessments and evaluations. Three types of assessments from psychometric methods:
- Formative assessments –a measurement tool used to measure growth and progress in learning and activity and can be used in games to alter subsequent learning experiences in games. Formative assessments represent a tool external to the learning activity, and typically occur in leading up to a summative evaluation.
- Summative assessments provide an evaluation or a final summarization of learning. Summative assessment is characterized as assessment of learning and is contrasted with formative assessment, which is assessment for learning. Summative assessments are also tools external to the learning activity, and typically occur at the end of the learning intervention to evaluate and summarize and is conducted with a tool that is external, not part of the training.
- An informative assessment guides and facilitates learning as part of the assessment. The assessment is the intervention. Successful participation in the learning results in evidence that learning has taken place. The behaviors in the activity have been shown to verify that learning has taken place. No external measures have been added on for assessment.
Games are typically used in the definition of what is an informative assessment. This makes sense, as a game, by its very nature, provides an activity along with assessments, measures, and evaluation. What, why, and how a game measures learning is of primary importance—and this is why serious game designers must learn assessment methods from the field of psychometrics if serious games are to grow as diagnostic tools, assessments, and evaluations.
If a game is to act as an informative assessment, it will stress meaningful, timely, and continuous feedback about learning concepts and process that are accurately depicted. As in an informative assessment, feedback in a game can be a powerful part of the assessment process. As the learner acts in the context of the games rule environment, they may learn the rules and tools through trial and error—eventually developing tactical approaches, and potentially formulate strategies from the possibilities for action deduced from learning from the in-game assessment criteria. This can be powerful.
Evidence supports this powerful learning tool. Research findings from over 4,000 studies indicate that informative assessment has the most significant impact on achievement (Wiliam, 2007). When serious games are built with same care as an informative assessment using methods from psychometrics, serious games can be as effective as an informative assessment.
Currently, most games are not designed as informative assessments. This means that learning in a serious game might suffer from the Vegas Effect. For a game to act as informative assessment, the game must accurately measure the learning the concepts, and the concepts from the game must transfer to other performance contexts—beyond the game. In order to achieve this, the issue of construct validity must be addressed.
For a serious game to have construct validity, the training interventions that they present must have been designed with emphasis on the creation of internal and external validity—what we model, how we measure it, and how it is presented in a game:
- External validity: the ability to generalize in-game learning to other contexts.  To what extent can a training effect from a game be generalized to other populations (population validity), other settings (ecological validity), other treatment variables, and other measurement variables?
- Internal validity: examines whether the adequacy of the study design, or in this case of the game, that the intervention was the only possible cause of a change in the players learning.
To do this, serious game development requires valid concepts for modeling, implementation, and assessment of what is to be learned, as well as how it will be measured outside the game. This is essential for ROI (return on investment) analysis. Serious game development requires research and construct validity to conduct ROI and to avoid the Vegas Effect. Learning that happens in games should not stay in games.

Leaving Las Vegas:
I have come across few if any games that have been designed with the kind of careful attention to research methodology that would be expected when measuring learning, intelligence, personality, or depression. Methods that ensure construct validity are expected in the field of psychometrics and the learning sciences, and may soon emerge as standard practice in serious game design.
Games are often designed to have surface validity. This means that the game APPEARS to measure what it is supposed to measure. Surface level validity is a useful beginning, but should only be considered a step towards having a valid assessment. It should be considered a gamble to build a serious game on surface validity. Designing a serious game on surface validity increases the likelihood of the Vegas Effect.
To reduce the likelihood of the Vegas Effect, a serious game designer could take their game and correlate learning outcomes with validated tools external to the serious game, such as formative and summative assessments. This method of validation is called criterion validity. To do this, the game designer might correlate success in the game with other diagnostic measures with verified content validity. For example, a claim may be made that a game improves working memory. This claim may be validated using the Dual N-Back Test for measures of working memory. The game designer might choose to have a sample of individuals take the Dual N-Back Task, play the game, and then use the Dual N-Back Task after the serious game to measure changes in working memory using the Dual N-Back Task as criterion for measuring changes in working memory.
Criterion validity is a powerful way to claim effectiveness, and reduce the likelihood of a Vegas Effect. However, the research design is essential in using criterion validity. One cannot simply have someone play their serious game and then attribute changes in the Dual N-Back score by correlation with having played the serious game . . . correlation does not imply causation. To validate the serious game with improvements in working memory on the Dual N-Back Task, the serious game developer should recruit methods from psychometrics such as a Repeated Measures Design, with attention to Sampling.
To really avoid the Vegas Effect, the serious game developer should adopt the gold standard: Construct Validity. Meaning that the learning designed into the game is measured with the same rigor as the diagnostic tools in psychometrics. Through designing games with construct validity, the game scenarios can be shown to be definitively delivering and measuring the theoretical construct. Although this is the gold standard, it requires significant investment in time and money to develop. There are however, some methods from psychometrics that can be adopted in the design process of a serious game to reduce the probability of the Vegas Effect.
One methodological step that can be taken towards construct validity is to conduct a study of inter rater agreement on the game elements that deliver instruction. The inter-rater reliability method can be used to identify and score of how much agreement there is on whether the game content is what we say it is. One way to do this is to individually present the game content to a number of sequestered subject matter experts and ask them to judge. For example, we might present judges with number of scenarios from a game about Decision Making Stages based upon B. Aubrey Fisher’s four stages of group decision making (Fisher, 1970). To do this, the game developer might present the game scenarios to an expert on this topic and ask them to judge, whether the scenario is an example of Fisher’s Orientation Stage in Group Decision Making? Here is the definition:
Orientation stage- this phase is where members meet for the first time and start to get to know each other.
When the expert judges the scenarios, the responses from all the judges can be gathered and inter-rater reliability can be calculated from the responses using Cohen’s Kappa. If the percentage of agreement is low, either the scale (game scenario) is defective or the raters need to be re-trained. If agreement is high, the game scenario is a step closer to construct validity.
Inter-rater agreement is a simple, low-cost method for increasing assessment and content validity. This is an example of how traditional research methods from psychometrics can be integrated as part of the design process from the beginning. As suggested here, an early step in the design process is to conduct tests of inter-rater agreement.
This is an excerpt from:
Dubbels, B.R. (in preparation) The Importance of Construct Validity in Designing Serious Games for Return on Investment.
Works cited:
Fisher, B. A. (1970). Decision emergence: Phases in group decision making. Speech Monographs, 37, 53-66.


